I don't normally devote a lot of space to a single company, but while researching to write about real-time business intelligence and analytics I ran across one I had never heard of before.
Vertica Systems specializes in databases that are built specifically for real-time and near real-time business intelligence and analytics. They claim database performance that is 50-1000 times faster than traditional data warehouses. How does Vertica accomplish this? In the most non-technical terms I can muster:
1. They organize the data differently than a traditional database, using a method called "columnar orientation." This makes it easier to get at just the data that are needed, faster than traditional queries.
2. They compress the data very aggressively. This allows them to, for example, store multiple copies of the same data sorted in different ways.
3. They store data for reading by queries differently than data to be written to the database, again to optimize the speed of data reads for queries.
4. They can take advantage of multiple processors on the database server.
5. Vertica wasn't designed to run on a specific kind of server hardware, but can run on anything that runs the Linux operating system. This should help hold down hardware costs.
Even though I hadn't heard of them, Vertica must be doing something right. They've quietly racked up an impressive client list that spans multiple industries. Clients include Twitter, Verizon, Bank of America, Comcast, Blue Cross Blue Shield, Sunoco, and most recently Groupon.
Thursday, January 27, 2011

Real-Time Business Intelligence: Technology and Strategy Implications
In an earlier article we discussed how increasing competition has led to the compression of the business intelligence life-cycle from a monthly to an almost continuous frequency in some cases. This challenges technology vendors and business strategists alike to respond to the new reality.
Technology Implications
When businesses updated their BI data monthly, processing of the data could be conveniently scheduled outside business hours. A processing window would be established (say, from 6 PM to 8 AM local time) for the data architects to extract, transform, and load (ETL) data from the transaction processing system such as sales orders or general ledger to the BI system. As demands for amounts and detail of BI data increased, it became more difficult to keep the processing within the allotted time window. But as long as this meant management occasionally had to wait until 10 AM or noon local time for monthly updates it wasn't a major problem. The flaw in this strategy was exposed by demands for more frequent updates.
Clearly what is needed from a technology standpoint is a more targeted and incremental approach to processing data. For example, a Microsoft SQL Server Analysis Services database (cube) can be programmed to monitor for changes in its source transaction system. After a change is detected, the cube can "listen" for a pre-determined amount of time to make sure there are no more changes to the source data, and then issue a request for only the new data. Since this represents a very small amount of data from the source system, and the portion of the cube that needs to be reprocessed is also quite small, the BI data update takes seconds instead of hours as in the old processing strategy. Other vendors are building similar capabilities. Another technique involves the use of database caching to constantly process changes to data in the background while continuing to present the latest available view of the data to the consumer.
Strategy Implications
Elsewhere on this site, I have advocated for a BI strategy that is in harmony with the way people interact with data. I introduced I concept I call the PRIME model, with five activities: Producing, Reviewing, Investigating, Monitoring, and Extrapolating. For more specifics, please feel free to click here. Based on the PRIME model, I can foresee three significant impacts on how businesses work with data as opposed to the current approach.
First, real-time BI and analytics will shift the focus of data consumption for knowledge workers, analysts and managers alike, from reviewing to monitoring. With a greatly reduced time window for the consumption of data before fresh data arrive, there simply won't be time to review and digest static reports. This will lead to a greater emphasis on business performance management. The traditional report will increasingly be boiled down to the presentation of a small number of key performance indicators (KPIs), along with strategic drivers of those KPIs.
Second, because data updates will occur too rapidly for a human analyst to investigate causes or extrapolate trends using traditional methods, there will be an increasing dependence on automated technologies for data mining and predictive analytics. The investigation and extrapolation performed through such automated technologies will feed into the monitoring I described in the last paragraph. These automated technologies will not supplant but will augment the knowledge worker, whose focus will shift toward longer-term strategic analyses.
Finally, the "24-hour BI cycle," as I described it in my previous article will drive an increasing reliance on mobile business intelligence, as managers and analysts require access to data wherever they are when business conditions change. IT will need the ability to push needed data to these knowledge workers, whether the client machine is a traditional PC, laptop, netbook, smartphone or tablet. It's not difficult to imagine that, over time the latter two devices will play a greater role as their capabilities and the wireless network infrastructure continue to improve.
Technology Implications
When businesses updated their BI data monthly, processing of the data could be conveniently scheduled outside business hours. A processing window would be established (say, from 6 PM to 8 AM local time) for the data architects to extract, transform, and load (ETL) data from the transaction processing system such as sales orders or general ledger to the BI system. As demands for amounts and detail of BI data increased, it became more difficult to keep the processing within the allotted time window. But as long as this meant management occasionally had to wait until 10 AM or noon local time for monthly updates it wasn't a major problem. The flaw in this strategy was exposed by demands for more frequent updates.
Clearly what is needed from a technology standpoint is a more targeted and incremental approach to processing data. For example, a Microsoft SQL Server Analysis Services database (cube) can be programmed to monitor for changes in its source transaction system. After a change is detected, the cube can "listen" for a pre-determined amount of time to make sure there are no more changes to the source data, and then issue a request for only the new data. Since this represents a very small amount of data from the source system, and the portion of the cube that needs to be reprocessed is also quite small, the BI data update takes seconds instead of hours as in the old processing strategy. Other vendors are building similar capabilities. Another technique involves the use of database caching to constantly process changes to data in the background while continuing to present the latest available view of the data to the consumer.
Strategy Implications
Elsewhere on this site, I have advocated for a BI strategy that is in harmony with the way people interact with data. I introduced I concept I call the PRIME model, with five activities: Producing, Reviewing, Investigating, Monitoring, and Extrapolating. For more specifics, please feel free to click here. Based on the PRIME model, I can foresee three significant impacts on how businesses work with data as opposed to the current approach.
First, real-time BI and analytics will shift the focus of data consumption for knowledge workers, analysts and managers alike, from reviewing to monitoring. With a greatly reduced time window for the consumption of data before fresh data arrive, there simply won't be time to review and digest static reports. This will lead to a greater emphasis on business performance management. The traditional report will increasingly be boiled down to the presentation of a small number of key performance indicators (KPIs), along with strategic drivers of those KPIs.
Second, because data updates will occur too rapidly for a human analyst to investigate causes or extrapolate trends using traditional methods, there will be an increasing dependence on automated technologies for data mining and predictive analytics. The investigation and extrapolation performed through such automated technologies will feed into the monitoring I described in the last paragraph. These automated technologies will not supplant but will augment the knowledge worker, whose focus will shift toward longer-term strategic analyses.
Finally, the "24-hour BI cycle," as I described it in my previous article will drive an increasing reliance on mobile business intelligence, as managers and analysts require access to data wherever they are when business conditions change. IT will need the ability to push needed data to these knowledge workers, whether the client machine is a traditional PC, laptop, netbook, smartphone or tablet. It's not difficult to imagine that, over time the latter two devices will play a greater role as their capabilities and the wireless network infrastructure continue to improve.
Tuesday, January 25, 2011
Real-Time Business Intelligence and Analytics: An Introduction
Previously we introduced the concept of a life-cycle for business intelligence data. Data are captured into transaction processing systems like the general ledger accounting system. At some interval these data are moved into a BI database and processed to make them suitable for consumption. At some point older data are archived or even removed when they are no longer useful.
At first the BI or decision support life-cycle was typically built around financial reporting, and thus depended on the quarterly or monthly accounting close. Once the books were closed for the accounting period, data were pulled from the accounting system, loaded into the BI or decision support database, reports were run, and data analyzed.
As BI moved beyond the financial realm, managers in business areas like Sales and Operations found that they could achieve competitive advantage by getting (and acting upon) more frequent updates of data as opposed to organizations that remained tied to the monthly accounting cycle. This spurred the increase in the frequency of data updates to weekly, daily, and so on. The result is an evolution toward a "24-hour BI cycle" that parallels the evolution toward a 24-hour news cycle in the news media. In some applications BI data are now updated almost continuously. Rather than being the exception, this high-frequency updating of data will increasingly become the rule.
The impetus toward real-time business intelligence and analytics has implications for both technology and business. Vendors are challenged to devise new solutions to the problems introduced by requirements for more frequent updates. With the increase in the amount and frequency of data updates, businesses need to rethink how they consume data. We'll address these issues in more detail in the next article.
At first the BI or decision support life-cycle was typically built around financial reporting, and thus depended on the quarterly or monthly accounting close. Once the books were closed for the accounting period, data were pulled from the accounting system, loaded into the BI or decision support database, reports were run, and data analyzed.
As BI moved beyond the financial realm, managers in business areas like Sales and Operations found that they could achieve competitive advantage by getting (and acting upon) more frequent updates of data as opposed to organizations that remained tied to the monthly accounting cycle. This spurred the increase in the frequency of data updates to weekly, daily, and so on. The result is an evolution toward a "24-hour BI cycle" that parallels the evolution toward a 24-hour news cycle in the news media. In some applications BI data are now updated almost continuously. Rather than being the exception, this high-frequency updating of data will increasingly become the rule.
The impetus toward real-time business intelligence and analytics has implications for both technology and business. Vendors are challenged to devise new solutions to the problems introduced by requirements for more frequent updates. With the increase in the amount and frequency of data updates, businesses need to rethink how they consume data. We'll address these issues in more detail in the next article.
Monday, January 24, 2011
Online Analytical Processing (OLAP), Continued
In the first of two articles discussing Online Analytical Processing (OLAP), we covered a bit of what OLAP is and how it was named. In this second introductory article, we'll discuss "flavors" of OLAP and try to cut through some of the "acronym fog" surrounding the concept.
Multidimensional OLAP (MOLAP)
When the term "OLAP" was first coined it was used to refer to this type of OLAP. It was called "multidimensional" because the database on which it was based was "multidimensional," which is different from the relational, table-based databases we've discussed elsewhere on this blog (especially in the articles referring to the Process stage of the BI data life-cycle). There are a couple of ways you can think of this. If you're a math genius, imagine data stored in multidimensional arrays. If you're more business-oriented, imagine the data stored as if it were in a tabbed spreadsheet. A common application for such a sheet would be an income statement:

Obviously, we are interested in more than just this information. We can get this from our accounting department. We might also like to know about our profitability by product. We could think about our products like tabs with a sheet for every tab like this:

The beauty (and beast) of MOLAP is that in theory we can have as many nested tabs as we want. Suppose we added Countries to our list of dimensions. We could represent it like this:

In order to get at the information I want as quickly as possible, I want to try and load as much of the data as I can into memory on the file server that passes the numbers to me. Notice that I have a lot of flexibility in how I define the relationships between the items in my MOLAP database. The four quarters aggregate, or "roll up," to the total year, as would the products and countries to "All Products" or "All Countries." Yet I can also subtract cost from sales to compute margin. In aggregate such databases are called "hypercubes" (since they can go beyond three dimensions) or simply "cubes."
The downside to all this power and flexibility is that the more dimensions I add to my cube, the bigger (and more difficult to manage) the cube becomes. The tech gurus refer to this problem by the colorful term "database explosion." To get around this, developers have created other types of cubes that work differently, but are trickier to program, than the "traditional" MOLAP cube as described here.
Relational OLAP (ROLAP)
Another approach to getting around the database explosion problem of multidimensional OLAP is to do OLAP using table-based, relational databases of the kind described elsewhere on the blog. In one of those articles we showed a representation of a "star" schema database that looked like this:
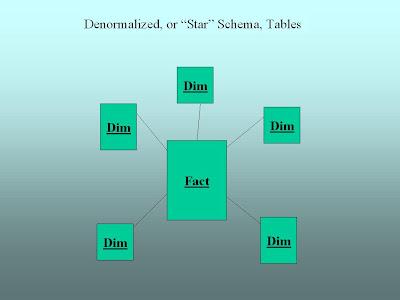
Relational OLAP (or ROLAP) is simply an attempt to make this table-based relational data behave like the cubes we talked about earlier. If you don't have a lot of data, this is slower than working with a cube. When you have the database explosion problem we talked about earlier, this approach can be a viable alternative to MOLAP.
Hybrid OLAP (HOLAP)
Hybrid OLAP is exactly what you might think from the name: an attempt to have the best of both multidimensional and relational OLAP by combining them. The way this works is that you keep the high-level data you want to get to quickly in a MOLAP cube and when you need detailed data the MOLAP cube passes a request for it to a relational database where the details are stored.
The Players
Most of the major BI vendors have an OLAP product. The best known are probably Oracle's Essbase, Microsoft's SQL Server Analysis Services (SSAS), and IBM Cognos' PowerPlay.
Multidimensional OLAP (MOLAP)
When the term "OLAP" was first coined it was used to refer to this type of OLAP. It was called "multidimensional" because the database on which it was based was "multidimensional," which is different from the relational, table-based databases we've discussed elsewhere on this blog (especially in the articles referring to the Process stage of the BI data life-cycle). There are a couple of ways you can think of this. If you're a math genius, imagine data stored in multidimensional arrays. If you're more business-oriented, imagine the data stored as if it were in a tabbed spreadsheet. A common application for such a sheet would be an income statement:

Obviously, we are interested in more than just this information. We can get this from our accounting department. We might also like to know about our profitability by product. We could think about our products like tabs with a sheet for every tab like this:

The beauty (and beast) of MOLAP is that in theory we can have as many nested tabs as we want. Suppose we added Countries to our list of dimensions. We could represent it like this:

In order to get at the information I want as quickly as possible, I want to try and load as much of the data as I can into memory on the file server that passes the numbers to me. Notice that I have a lot of flexibility in how I define the relationships between the items in my MOLAP database. The four quarters aggregate, or "roll up," to the total year, as would the products and countries to "All Products" or "All Countries." Yet I can also subtract cost from sales to compute margin. In aggregate such databases are called "hypercubes" (since they can go beyond three dimensions) or simply "cubes."
The downside to all this power and flexibility is that the more dimensions I add to my cube, the bigger (and more difficult to manage) the cube becomes. The tech gurus refer to this problem by the colorful term "database explosion." To get around this, developers have created other types of cubes that work differently, but are trickier to program, than the "traditional" MOLAP cube as described here.
Relational OLAP (ROLAP)
Another approach to getting around the database explosion problem of multidimensional OLAP is to do OLAP using table-based, relational databases of the kind described elsewhere on the blog. In one of those articles we showed a representation of a "star" schema database that looked like this:
Relational OLAP (or ROLAP) is simply an attempt to make this table-based relational data behave like the cubes we talked about earlier. If you don't have a lot of data, this is slower than working with a cube. When you have the database explosion problem we talked about earlier, this approach can be a viable alternative to MOLAP.
Hybrid OLAP (HOLAP)
Hybrid OLAP is exactly what you might think from the name: an attempt to have the best of both multidimensional and relational OLAP by combining them. The way this works is that you keep the high-level data you want to get to quickly in a MOLAP cube and when you need detailed data the MOLAP cube passes a request for it to a relational database where the details are stored.
The Players
Most of the major BI vendors have an OLAP product. The best known are probably Oracle's Essbase, Microsoft's SQL Server Analysis Services (SSAS), and IBM Cognos' PowerPlay.
Thursday, January 20, 2011
BI Concept: Online Analytical Processing (OLAP)
As we've discussed elsewhere on this site, business intelligence data have a life-cycle like other parts of the business, beginning with capturing, then processing, consuming, and finally archiving the data. The computer systems associated with the first, or Capture phase of the life-cycle, are typically referred to as Online Transaction Processing (OLTP) systems. These systems are usually designed, as we've noted, for getting data in rather than out.
OLTP systems were around for some time before anyone got the idea to dump data out of them and into a separate system for analysis purposes. Based on the notion of an OLTP system being one in which business data are captured as transactions, one would think that any system designed for data analysis should be designated as an Online Analytical Processing (OLAP) system. Not so.
The OLAP acronym was, in fact, born in controversy. It was coined in the early 1990's by relational database pioneer Dr. E. F. Codd. Dr. Codd had been consulting for Arbor Software, who had just introduced a new multidimensional database engine called "Essbase." He published a paper outlining what an OLAP database should do, and lo! it said that an OLAP database should do what Essbase does! When it was later revealed that Dr. Codd had been a paid consultant for Arbor, he lost credibility in the IT industry. But the definition of OLAP had been established to mean a very specific type of database. Over the course of time, this definition has evolved somewhat.
OLTP systems were around for some time before anyone got the idea to dump data out of them and into a separate system for analysis purposes. Based on the notion of an OLTP system being one in which business data are captured as transactions, one would think that any system designed for data analysis should be designated as an Online Analytical Processing (OLAP) system. Not so.
The OLAP acronym was, in fact, born in controversy. It was coined in the early 1990's by relational database pioneer Dr. E. F. Codd. Dr. Codd had been consulting for Arbor Software, who had just introduced a new multidimensional database engine called "Essbase." He published a paper outlining what an OLAP database should do, and lo! it said that an OLAP database should do what Essbase does! When it was later revealed that Dr. Codd had been a paid consultant for Arbor, he lost credibility in the IT industry. But the definition of OLAP had been established to mean a very specific type of database. Over the course of time, this definition has evolved somewhat.
Wednesday, January 19, 2011
Are You In The Market For An Appliance?
There's a lot of buzz in the business intelligence world these days about appliances. At first blush the term sounds confusing. It evokes images of something you would find in your kitchen rather than in the IT server room. In fact, appliances for business intelligence applications have been around in some form for decades.
So what's an appliance?
In the 1980's, the advent of personal computers and networking made it possible for small businesses to enter the computer age in great numbers for the first time. Unfortunately, most small business owners lacked either the time or skill to put together an integrated business solution. And if the business owners could find people with the time and necessary skill, they couldn't afford them. This created opportunities for systems integrators who stepped in with bundled hardware and software solutions, tailored for specific business applications. Such solutions were called "turnkey systems," because it was already installed and configured and all you needed to do was "turn the key" and drive the system.
Fast forward a few years and vendors responding to the need for "turnkey" solutions for data warehousing began building and configuring "data warehouse appliances" along very similar principles. The appliance is a bundle of hardware and software that has been pre-configured and optimized for a specific application, such as data warehousing. (Need background on data warehousing, schemas, etc.? Review Parts One and Two on processing data in the BI data life-cycle and the Data Warehouse Imperative.)
Why would I want an appliance?
You can make a very strong business case for buying an appliance rather than trying to build your business intelligence or data warehouse solution from scratch. Some of the key advantages are listed below:
The hardware and software are pre-selected and installed for you.
The system is configured and sold based on the amount of data you're pulling out of your source system, removing much of the guesswork involved in tweaking the system for performance.
Many appliances come with extras like administration consoles, to make system management easier. This can be a major consideration for small or medium sized businesses.
The appliance vendor becomes the single point of contact for all support. This can be huge. Just ask your IT person how many times he or she has stressed over troubleshooting system issues when the hardware vendor is blaming the software vendor and vice versa. And how much money has that, in turn, cost you?
So what's the catch?
You would think that for providing all this wonderful service, the integrator who puts this all together would charge a stiff premium over the cost of the hardware and software components bought separately. Actually, Gartner Research has found that this is not the case. But all is not paradise. You still have to design and maintain the database side of the data warehouse, or schema. Many vendors have pre-built schemas available, but these are only starting points for you to customize for your business.
Before I bought a data warehouse appliance (or similar - Microsoft has, for example, just released a "decision support" appliance bundle) I would ask some pointed questions of my prospective vendor partner:
Can I talk to other customers that you've worked with before to gain the benefit of their experience with you?
If I'm a growing business, how much flexibility do I have to expand as my needs change? How much is that going to cost me?
Are you (vendor) willing to commit to a long-term business relationship? And how will that work from your end?
And, of course, many others that are typical for any vendor/customer relationship, like service levels, do we get any cool logo schwag, etc.
Who are the major players?
Beside the aforementioned Microsoft, most of the big BI vendors participate in this market, either directly (Teradata) or through proxies (for example Netezza, a former independent now part of IBM).
So what's an appliance?
In the 1980's, the advent of personal computers and networking made it possible for small businesses to enter the computer age in great numbers for the first time. Unfortunately, most small business owners lacked either the time or skill to put together an integrated business solution. And if the business owners could find people with the time and necessary skill, they couldn't afford them. This created opportunities for systems integrators who stepped in with bundled hardware and software solutions, tailored for specific business applications. Such solutions were called "turnkey systems," because it was already installed and configured and all you needed to do was "turn the key" and drive the system.
Fast forward a few years and vendors responding to the need for "turnkey" solutions for data warehousing began building and configuring "data warehouse appliances" along very similar principles. The appliance is a bundle of hardware and software that has been pre-configured and optimized for a specific application, such as data warehousing. (Need background on data warehousing, schemas, etc.? Review Parts One and Two on processing data in the BI data life-cycle and the Data Warehouse Imperative.)
Why would I want an appliance?
You can make a very strong business case for buying an appliance rather than trying to build your business intelligence or data warehouse solution from scratch. Some of the key advantages are listed below:
The hardware and software are pre-selected and installed for you.
The system is configured and sold based on the amount of data you're pulling out of your source system, removing much of the guesswork involved in tweaking the system for performance.
Many appliances come with extras like administration consoles, to make system management easier. This can be a major consideration for small or medium sized businesses.
The appliance vendor becomes the single point of contact for all support. This can be huge. Just ask your IT person how many times he or she has stressed over troubleshooting system issues when the hardware vendor is blaming the software vendor and vice versa. And how much money has that, in turn, cost you?
So what's the catch?
You would think that for providing all this wonderful service, the integrator who puts this all together would charge a stiff premium over the cost of the hardware and software components bought separately. Actually, Gartner Research has found that this is not the case. But all is not paradise. You still have to design and maintain the database side of the data warehouse, or schema. Many vendors have pre-built schemas available, but these are only starting points for you to customize for your business.
Before I bought a data warehouse appliance (or similar - Microsoft has, for example, just released a "decision support" appliance bundle) I would ask some pointed questions of my prospective vendor partner:
Can I talk to other customers that you've worked with before to gain the benefit of their experience with you?
If I'm a growing business, how much flexibility do I have to expand as my needs change? How much is that going to cost me?
Are you (vendor) willing to commit to a long-term business relationship? And how will that work from your end?
And, of course, many others that are typical for any vendor/customer relationship, like service levels, do we get any cool logo schwag, etc.
Who are the major players?
Beside the aforementioned Microsoft, most of the big BI vendors participate in this market, either directly (Teradata) or through proxies (for example Netezza, a former independent now part of IBM).
Tuesday, January 18, 2011
Taking a Breather
Thanks for stopping by. I'm taking a break from writing this evening (US Central Time) but have several BI-related topics I want to research and write with a business focus. Here are a few:
- Online Analytical Processing (OLAP)
- Data Warehouse Appliances
- Performance Management (including the Balanced Scorecard)
- News and trends in BI and their potential business impact
Feel free to suggest other topics you would like to see in the blog by leaving a comment. I promise a quick response. Take care.
- Online Analytical Processing (OLAP)
- Data Warehouse Appliances
- Performance Management (including the Balanced Scorecard)
- News and trends in BI and their potential business impact
Feel free to suggest other topics you would like to see in the blog by leaving a comment. I promise a quick response. Take care.
Subscribe to:
Posts (Atom)