The most efficient approach is to have a separate data space that is designed to make it easy to get data out for reporting, analysis, and other kinds of business intelligence. Depending on your company’s size and budget, this can be as big as a data warehouse that stores gigabytes or even terabytes of data in industrial-strength databases from IBM, Oracle, or Teradata. Or it could be as simple as a Microsoft Access database or even an Excel spreadsheet (we'll stop briefly here to give any technical gurus who may be eavesdropping a moment to recover). We’ll “process” the data from the transactional system (such as the point-of-sale system we’ve been using as an example) by dumping data out of it and loading it into the separate data space we’ll use for business intelligence.
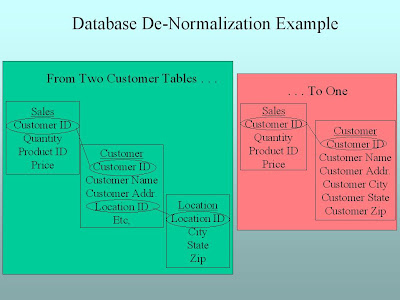
One thing to note: the structure or schema of the database you use for consuming the data (the next step in the lifecycle following processing, where the meat of business intelligence takes place) will be different from the schema you use to capture it. How so? Remember that one of the problems with having that normalized data table structure was that there were so many tables to deal with. So when we process the data to get it ready for consumption, we’ll “denormalize” it. We see an example of this in the following graphic.

No comments:
Post a Comment