Of all of the activities in the PRIME model, investigation is probably the one most widely associated in the business person’s mind with the function of the contemporary knowledge worker/analyst. The analyst, typically responding to a query from management resulting from a reviewing or monitoring activity, examines data at increasing levels of detail in order to find out for the boss what went right or wrong. This examination at levels of increasing detail is often referred to as “drilling down” or “drilling in” to the data. If successful, the investigator uncovers information that was previously unknown and produces new data.
As business processes have become more complex and the amount of data collected about them has grown exponentially, some aspects of the investigation function have been automated through the introduction of data mining tools. In these cases the role of the analyst changes from that of interacting directly with data by drilling down into the details to a more interpretive role of determining the meaning of results from data mining output. However, the analyst’s fundamental investigative function is unchanged. The analyst may well drill down into data in order to better understand and quantify hidden relationships unearthed by the data mining process.
Next Topic: Monitor
Friday, December 31, 2010
Thursday, December 30, 2010
PRIME Model: Review Category
Among the activity categories that are most strongly associated with data consumption, reviewing is the most passive. By definition, “reviewing” implies looking back on events that have already occurred in the past. Most traditional forms of reporting are examples of the Review category. Profit and Loss, Changes in Cash Flow, Balance Sheets – all entail looking passively at static data.
In most traditional business firms, review is the first step in a cyclical management process. It goes something like this. Management from the top down reviews quarterly or annual results. This review process typically triggers inquiries about how or why results occurred (or didn’t). The inquiries are then passed to knowledge workers who interact with data in more dynamic ways (as we’ll discuss later) in order to provide answers to the queries.
I was tempted to call this category the “report” category. It’s true that all the examples I cited a couple of paragraphs ago are traditional reports. But I resisted the impulse because I wanted the model to be activity based, and a report is more appropriately considered as the object of the “review” activity than as an activity in itself. And it’s also possible that the object of a review could be something other than a report, although nothing else comes immediately to mind.
Next Topic: Investigate
Wednesday, December 29, 2010
PRIME Model: Produce Category
Before consuming data in the business intelligence life-cycle, humans interact with data by producing it. This happens when they enter data into a transaction system, and it also happens in the Process stage of the life-cycle in cases where data from the transaction system are transformed to create new data prior to loading into the data warehouse or other BI data space. For more information about these processes, you can review the previous sections on “Capturing and Processing Data.”
But we also produce data as a result of other interactions we have with the data. Take the example of a knowledge worker who, in the process of analyzing accounting data, has an insight about what is going on with the business based on those data. In documenting that insight, the knowledge worker effectively creates or produces new data that did not previously exist. (Note that I could have used the word “create” for this activity, but the “CRIME” model just didn’t have the same ring to it.) In a similar fashion, an analyst working with data mining tools can use those tools to give previously unknown meaning to a hidden relationship he or she finds in data.
Even though the Produce category is not as pertinent as others in a discussion of consuming data, it is still an important component of the model and so I chose to include it with the rest of the model here rather than introducing the entire PRIME model in the earlier material on capturing and processing data.
Next Topic: Review
Tuesday, December 28, 2010
How We Interact With Data: The PRIME Model
Based on my experience and observations, I classify the way in which humans interact with data into five categories of activity:
Produce
This activity consists mainly of creating, updating, and transforming data and is the primary focus of the Capture and Process phases of the BI life-cycle.
Review
The focus of this activity is the passive consumption of static data.
Investigate
This activity involves a person drilling into or analyzing data in an effort to answer questions about one or more business processes represented by the data. Some of this activity may be automated through the use of data mining tools.
Monitor
I define monitoring as the exact opposite of reviewing; that is, active consumption of dynamic data. More on this later.
Extrapolate
Unlike other activities that focus on past results or present conditions, extrapolation attempts to predict future outcomes based on present conditions. The goal of this activity is to capitalize on potential future opportunities while avoiding or minimizing potential future threats.
Those of you who have poked into business intelligence before have probably run across a conceptual model that is different from this, in that it represents BI as a pyramid, like the following graph:
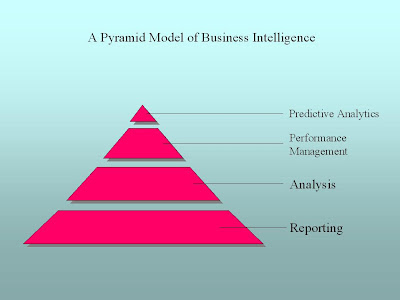
I like the PRIME approach over the pyramid approach for the following reasons:
1. There’s an implication that the higher you are on the pyramid the more sophisticated you are as a business intelligence operation. PRIME doesn’t care about that, but rather sticks to the activities involved so you can focus on the right tool for the activity.
2. Various manifestations of the pyramid approach tend to focus on applications like reporting, analysis, etc. As we’ll see, PRIME maps into these applications pretty well, but PRIME focuses on the activity rather than the application used for the activity.
Next, we’ll dig deeper into the activity categories of the PRIME model.
Next Topic: Produce
Monday, December 27, 2010
Consuming Data: Introduction
Previously, we’ve discussed the first two stages in the business intelligence life-cycle, capture and processing. Once you’ve completed those steps and have data in your data warehouse or Microsoft Access database, what then? The answer to that question depends on the (1) questions you want to ask and (2) how you want to interact with the data.
The Questions I Want To Ask?
Well, duh, you say. But believe it or not, it seems to me that sometimes business people think the software is going to tell them everything they need to know without needing to ask. I remember as a kid watching the old “Batman” TV series. (Yes, it was first-run, not reruns; I am that old.) Whenever the Caped Crusader got stumped, he would feed the available data into the trusty “Bat Computer” and it would spit out the exact answer he needed. It seemed effortless, especially to a seven-year-old. (OK, I’m not that old!) Even the tools we have today for data mining and analytics aren’t as precise as the Bat Computer. So, although it may seem ridiculous you really do need to think about what kinds of questions you want to answer.
The more specific you can make your questions, the better off you’ll be. For example, “how are we doing this quarter?” isn’t really that great a question. A better question would be, “what are the trends of our sales and profit, for the quarter to date, quarter over quarter, and year over year?” If you’re already thinking in those terms, great! We’re ready to start thinking about how we interact with the data.
Friday, December 24, 2010
Happy Holidays!
The blog is taking the day off to celebrate Christmas Eve and Christmas Day in North America and elsewhere.
Merry Christmas
Feliz Navidad
Joyeux Noel
Merry Christmas
Feliz Navidad
Joyeux Noel
Thursday, December 23, 2010
ETL: Creating Data For BI - Transformation and Loading
Putting our transactional data in a format that will be suitable for use in business intelligence involves three sets of operations, in sequential order. First, we extract the data from the transactional system or systems. Next, we transform the extracted data to prepare it for consumption. Finally, we load the transformed data into the data warehouse or BI database. BI professionals refer to these operations in total as "Extraction, Transformation, and Loading," or simply “ETL.” This article discusses Transformation and Loading.
Transformation
Once the data are extracted from the transaction system, they typically need to be transformed to prepare them for business intelligence use. Some of the more common transformation operations include the following (to mention just a few):
• De-duplication: Find and remove duplications of customers, products, etc. This is critical if you’re pulling data from two or more transaction systems, as in the case discussed in an earlier article where you have a brick-and-mortar store and an e-commerce store that aren’t integrated together. Speaking of which:
• Merging: When we have data from multiple systems we also need to combine them so that we have a single view across the whole business
• Data conversions: These might include things like currency conversions, converting English to Metric measures or the other way around, and so on.
• Data cleansing: No matter how careful you are in entering data into the transaction system, there will inevitably be errors that no one catches. A well-designed ETL system can be your best defense against such errors slipping through and distorting your view of the business.
• De-normalization: Preparing the data for going from snowflake to star schema. Sometimes this will be done as part of the extraction step.
Loading
Having been extracted and transformed, the data are now loaded into the data warehouse or BI database. Depending on the kind of database you’re using to do BI, there may be other operations that occur during or after this step, such as aggregations. By aggregation we mean that we summarize or “roll up” the data depending on the dimensions in the database so that we can later “drill down” from higher to lower levels of detail.
Wednesday, December 22, 2010
ETL: Creating Data For BI - Extraction
Putting our transactional data in a format that will be suitable for use in business intelligence (BI) involves three sets of operations, in sequential order. First, we extract the data from the transactional system or systems. Next, we transform the extracted data to prepare it for consumption. Finally, we load the transformed data into the data warehouse or BI database. BI professionals refer to these operations in total as "Extraction, Transformation, and Loading," or simply “ETL.” This article discusses Extraction.
The first step in processing is to extract data from the database where our transaction records are kept. Because we want to minimize any interference with daily business operations that use the transactional system, we typically perform our processing outside of normal business hours. A database administrator (DBA), data architect (DA), or someone else responsible for business intelligence would begin by creating a query that pulls the needed data from the transactional database. With today’s computer systems it’s relatively easy for a system administrator to then create an automated process that runs the query late at night.
Larger companies may use software tools developed especially for ETL that incorporates the extraction query into the larger process. Some of the better-known competitors in this market include Informatica, Ab Initio, and International Business Machine (IBM) Inc.’s DataStage. Depending on the level of sophistication of the ETL process the data that are extracted may be saved into a text file or may be pulled directly into a separate data store for transformation. Sometimes, by clever use of Structured Query Language (SQL), data records can be partially transformed as they are extracted.
Tuesday, December 21, 2010
Processing Data For Business Intelligence (Part Two)
This article expands on concepts discussed in "Processing Data (Part One)." If you have not read that article, I suggest you do so before proceeding.
In the point-of-sale (POS) transaction system we’ve talked about previously, the database designer normalized customer data into two tables (one for Customer, one for Location) in order to avoid repeating city, state, and zip for each customer. When we process the data for consumption, we'll want to “denormalize” the data into a single table that puts all the location data together with the customer data. Why? By cutting down the number of tables we have to get data from, we make it quicker and easier to get data out of the database for reporting, analysis, and other kinds of business intelligence. When this process is complete, the database schema will most likely look like a star.
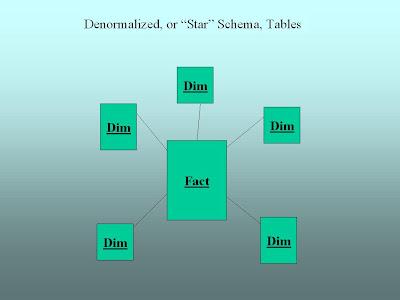
Notice that there are labels on each table. The central table is labeled “Fact.” In data warehouse parlance, the “fact” table contains information about business events that we want to measure. In our point-of-sale example our facts would probably be made up of the individual items our customer purchased on his or her visit to the store or web site. Each record in the fact table might look similar to the record we displayed when we discussed “Capturing Data” previously.
The tables around and connected to the fact table are labeled “Dim.” These represent what we’ll call “dimension” tables. When we talk about a dimension, we really just mean some aspect of the data that we’re interested in. In our point-of-sale example we’ve talked about Customers, Products, and Locations. All of these could be dimension tables in our data warehouse. Other dimensions might include Time (so we know when things are selling), Campaign (if we’re interested in knowing how the customer found us), and the list goes on and on. If this sounds a little confusing, think about how you want to look at your business. You might say to yourself, “I’d really like to see sales by customer by product by salesperson by month.” Each of these “bys” we listed off (Customer, Product, Salesperson, Month – or more generally Time) would be viable dimension candidates for our data warehouse. Sales would be our primary fact.
Monday, December 20, 2010
Processing Data For Business Intelligence (Part One)
In a previous article, we discussed how the data structure or schema that works best for getting data (like sales, customers, and products) into your transaction system doesn’t necessarily work the best for getting the data out. As we noted, there are two reasons for this. First, the descriptive data you need is spread across so many database tables it’s a pain to get at. Second, if you’re pulling the data while other people are using the system for processing (sales, for example) you risk bogging them and the business down. So what’s the solution?
The most efficient approach is to have a separate data space that is designed to make it easy to get data out for reporting, analysis, and other kinds of business intelligence. Depending on your company’s size and budget, this can be as big as a data warehouse that stores gigabytes or even terabytes of data in industrial-strength databases from IBM, Oracle, or Teradata. Or it could be as simple as a Microsoft Access database or even an Excel spreadsheet (we'll stop briefly here to give any technical gurus who may be eavesdropping a moment to recover). We’ll “process” the data from the transactional system (such as the point-of-sale system we’ve been using as an example) by dumping data out of it and loading it into the separate data space we’ll use for business intelligence.
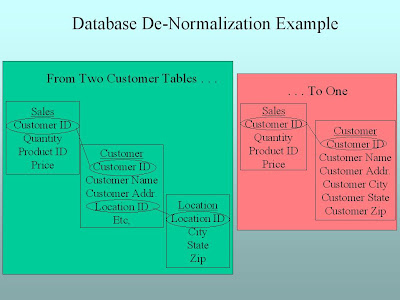
One thing to note: the structure or schema of the database you use for consuming the data (the next step in the lifecycle following processing, where the meat of business intelligence takes place) will be different from the schema you use to capture it. How so? Remember that one of the problems with having that normalized data table structure was that there were so many tables to deal with. So when we process the data to get it ready for consumption, we’ll “denormalize” it. We see an example of this in the following graphic.
The most efficient approach is to have a separate data space that is designed to make it easy to get data out for reporting, analysis, and other kinds of business intelligence. Depending on your company’s size and budget, this can be as big as a data warehouse that stores gigabytes or even terabytes of data in industrial-strength databases from IBM, Oracle, or Teradata. Or it could be as simple as a Microsoft Access database or even an Excel spreadsheet (we'll stop briefly here to give any technical gurus who may be eavesdropping a moment to recover). We’ll “process” the data from the transactional system (such as the point-of-sale system we’ve been using as an example) by dumping data out of it and loading it into the separate data space we’ll use for business intelligence.
One thing to note: the structure or schema of the database you use for consuming the data (the next step in the lifecycle following processing, where the meat of business intelligence takes place) will be different from the schema you use to capture it. How so? Remember that one of the problems with having that normalized data table structure was that there were so many tables to deal with. So when we process the data to get it ready for consumption, we’ll “denormalize” it. We see an example of this in the following graphic.

Friday, December 17, 2010
Capturing Data For Business Intelligence (Part Two)
In "Capturing Data (Part One)" we discussed a bit about how transaction data are stored in database tables and began to develop the idea that such data are designed (or "architected") to get data in as easily and accurately as possible. This article expands on these concepts. If you haven't already, you should read "Capturing Data (Part One)" before continuing.
When we left our point-of-sale (POS) transaction system in the previous article, we had taken the customer and product names and replaced them with unique identifying codes, so that
Jones, B., 1 lb. Coffee @ $ .01
became
325, 1, 22, .01
But who can make sense of that just by looking at it?! (OK, maybe a geek like me could, but please!) In order to preserve descriptive customer and product information, the database designer for the POS system ends up moving them to their own tables and linking these tables to the sales transaction table. Now instead of one table there are three.
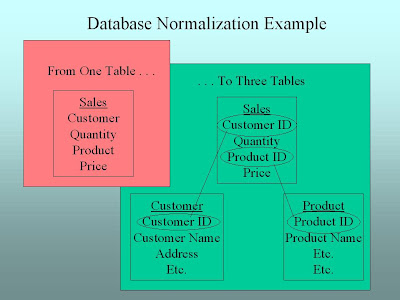
The technical term for this process is “database normalization.” The advantage of doing this in the data entry process is that we don’t have to type in “B. Jones” or “Coffee” every time we sell coffee to him/her. We type the descriptive information about them into the Customer or Product tables the right way one time and then have the computer look them up when we need them for a sale. If we take this to the next step, suppose we want to know the supplier for a particular product. Using normalization, we would create a “Supplier” table and separate it from the “Product” table. And on it goes. Putting only the information we need in each table and repeating it as little as possible in other tables leads to a table structure that looks like this:
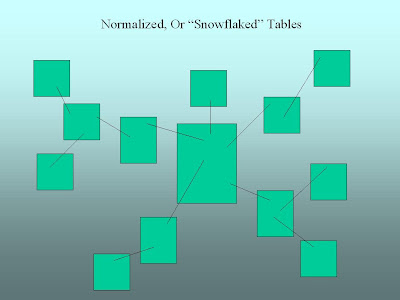
This kind of a table structure is often called a “snowflake.” The good news about this snowflake "schema" (as the structure is called in more technical terms) is that it’s easy and efficient to get transaction data into the system. This is because being able to look up information about customers and products cuts down on data entry errors and makes the process go more quickly and smoothly. The bad news comes when you try to get data out of the system, because in order to make the information you get out descriptive and/or meaningful you have to pull data from a lot of tables. Most POS system designers understand this and try to help you out by providing basic reporting. But if you’re trying to get data out of all of those tables at the same time sales clerks are trying to enter orders for customers, the system can really bog down. This why we create a separate data warehouse space for business intelligence purposes, and that is where processing comes in.
Thursday, December 16, 2010
Capturing Data For Business Intelligence (Part One)
Earlier we touched on the idea that the format in which we capture data is not necessarily the same format in which we want to have it available for reporting. Let’s now go into more detail on this idea. When you input data into a point-of-sale (POS) system, the data are stored in a database. Such a database is typically set up in a tabular format. This means that however the bits of sale data were input, whether typed in or scanned from a bar code, they’re stored in rows and columns. Thus what we call a database table is really just an arrangement of data into rows and columns, where each row (also called a record) represents a single transaction, customer, or whatever, and each column (also called a field) represents the details of interest to us in that transaction, customer, or whatever. Think back to the general store example from several articles ago:
Jones, B., 1 lb. Coffee @ $ .01
This would represent a single transaction record in our sales database table, with fields for Customer, Quantity, Product, and Price. If a database designer were to express this as a database table it might look something like this:
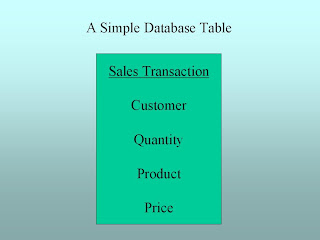
This was fine in the Old West, but in the 21st century there are all sorts of potential problems. First, what if there’s more than one B. Jones in the customer database? How do you make sure the right one gets credit for the sale? The typical solution to this problem is to create a unique identifying number for each customer that’s separate from the name. So this B. Jones might become customer #325. We’ll also need to do this with the product “Coffee.” After all, nobody’s perfect when it comes to data entry. At the end of the month you may want to know how many pounds of “Coffee” you sold, but if it gets entered to the POS system as “Coffee,” “Cofee,” “Coffe,” and so on, you’re out of luck. So the system designers eliminate this problem by giving “Coffee” a unique product identifier (or just “ID” for short), say #22. Now our record looks like this:
325, 1 lb., 22, .01
To be continued . . .
Wednesday, December 15, 2010
Data Architecture 101
Someone who lays out the plan for a building is called an “architect.” The building plan as the architect lays it out is called the building’s “architecture.” In a similar way, we commonly call the layout of data for use by a business or other organization its “data architecture.”
The architecture of a building depends a lot on how the building is going to be used. For example, you wouldn’t expect an office building to be designed exactly the same as a factory or a grocery store. The same is true with data. The type of data architecture that works best to get a lot of data into a system, like a point of sale terminal, isn’t necessarily the best one to get the data out of that system. If you try to get the data out during business hours you risk slowing down the ongoing process of getting data in. The last thing you would want is to make a customer wait because you’re pulling a report from the same system you’re using to sell them something.
To make matters worse, consider what happens when, like our specialty retail store (for background see the article on the data integration imperative), you now have two different places where you have sales data (one in-store and one online). Now you have to pull sales reports from two different places. Do you want information by customer? Are you sure all the customers in the two systems are different? How do you know? Maybe you can just settle for sales by postal code, if you capture the postal code information in the store at the point of sale. And let’s hope the clerk (or you) didn’t fat-finger any of the Zip Codes. Of course, if you don’t have a choice you don’t have a choice. But this is why sooner or later growing businesses take a long look at data governance, data integration, and the data warehouse concept.
Tuesday, December 14, 2010
About The Data Warehouse Concept
In recent articles we've been talking about data governance and data integration and why these are so important to your business. One of the key best practices for successful governance and integration is to keep business intelligence data separate from transaction data (such as the data in your accounting or point of sale systems).
Once you grow your business to the point where you need the concepts discussed here, you’ll probably want a technical guru to head up the implementation. Remember as we go that my idea is not to make you that guru, but to give you enough information to be an intelligent consumer of the products and services that make a sustainable BI program possible.
One very important principle behind that sustainable BI program is that we want a separate place for the data we’re going to consume, away from the sources from which we captured the data in the first place. Different people may give different names to this separate place. For our purposes right now let’s use the term “data warehouse.” This isn’t completely accurate, because the term “data warehouse” has a very specific meaning for BI professionals. So we’ll come back to this later.
But for now, as a simplification, we’ll say that we take data from where it was captured, do some processing with it, and load it into the data warehouse. There are good reasons for this. First, the systems designed to capture the data are not typically designed to get data out as easily as it gets in. Second, as we’ve hinted at previously there may be two or more sources of data that need to be combined in a way that is meaningful for your business.
Monday, December 13, 2010
The Data Integration Imperative
Consultants and experts in the BI field use the terms “data governance” and “data integration” to talk about how to approach the kinds of problems we’ve been discussing in this section of the material. These fundamental concepts lie at the heart of the “integrated and coordinated” part of the definition we gave earlier for BI as a whole. Previously, we introduced data governance in two articles. This article introduces the concept of data integration.
Whereas data governance (in my opinion, at least) is really a people concept that requires a human touch to manage properly, data integration is more a technical concept for implementing the parts of data governance policy that call for BI to reflect the business as a whole. Put another way, data integration is the activity of pulling together data from systems all over the business and tying it all together so it says something meaningful about the whole business.
If you’re just starting your own business, or you’re in a business unit of a company where there is little or no data governance in place, data integration is simply not a high priority. You may only have one set of data to work with, as was the case in “'Real' World Story #1.” In that case the output was meant strictly for internal consumption by the sales force. In the case of the fictional specialty retail store we discussed earlier, the only data available in the beginning might be point of sale data plus some cost data.
But as the business grows in size and data accumulate in more and different places, data integration becomes more and more important. As our specialty retail store develops, sales are collected both in the store and online. Also, there may now be shipping data sitting in a completely different place. Without some way of tying all of this together it becomes difficult to impossible to get the big picture of how the business is doing. So whether you need it or not to begin with, it’s never too early to start thinking about and planning for data integration in your business.
Sunday, December 12, 2010
BI Concept: Software as a Service (SaaS)
There's been a buildup of buzz in recent months around the terms "Software as a Service" (SaaS) and "cloud computing." SaaS hss been touted as "the next big thing" for a number of different applications, including business intelligence.
What is "The Cloud?"
The simplest answer is: it's simply the Internet. I first heard the term "cloud" used in an IT context to describe data communications. There it was used to describe how data moved most efficiently from a source to a destination. "Cloud" has since been applied to the idea of allowing computer software to run over the Internet instead of having it on your local desktop or network server.
Since the application is being "served" to you over the Internet, you're running the software as a service, hence the acronym. If you've played Web-based online games, you've probably already used SaaS.
But BI isn't a game
Playing Bejewled over the Internet is one thing; using business intelligence tools over the Internet is something else. In order to use the tools you have to supply the application with your business data, either by uploading it to the service provider or by allowing the service provider access to the data inside your company's firewall. In the new age of "spies without borders" (see my article WikiLeaks and Beyond) this can be a disconcerting prospect. But if you can accept the risk, there are potential advantages in going the SaaS route.
Evaluating SaaS
In financial terms you can look at the decision to go with SaaS as a classic "lease versus purchase" decision with a few twists. The advantages are that you don't have a large initial investment in servers, licenses, or human resources. You simply pay for what you need now, and buy more as you need it later. If the vendor also markets its software for licensing on your own servers (as is the case with SAP Business Objects or IBM Cognos) it's a potential opportunity to "try before you buy."
The disadvantages are that you're at the mercy of multiple failure points. If the vendor's website or your internet router goes down at a critical time, you're stuck. But if you're already comfortable using another SaaS product like Salesforce.com this may not be such a big problem for you.
Friday, December 10, 2010
Data Governance (Part Two)
This is the second of two articles introducing the concept of data governance.
Now we’re going to introduce a theme that will return over and over again in different contexts throughout this blog: if you’re the boss, you need to be on board for any of this to work well. By “the boss” I mean the owner if it’s a small business, and a non-IT C-level executive (Chief Executive Officer, Chief Operating Officer, Chief Financial Officer in that order of preference) if it’s a larger business.
Why this order of preference? The CEO by definition has the most clout: typically the COO and Chief Information Officer (CIO) both report to her, and she can easily delegate responsibility for the data governance process jointly through them. The COO, having direct responsibility for day-to-day operations, is the next best choice. The CFO is more of a dicey choice because in most mature businesses IT grew up as an arm of finance and accounting and was later split off into a separate unit. Because of this, the relationship between IT and finance and accounting is often either too cozy (if the split was friendly) or too adversarial (if it wasn’t).
And why do we need the boss on board in the first place? Especially in larger companies, politics can play a huge role in the governance process. It’s only natural that stakeholders in the governance process will fight tooth and nail for the definitions, policies, and procedures that are most favorable to their business units. The boss needs to firmly and consistently champion the process as a whole, and to set guidance that places the overall business strategy for data governance above departmental politics.
Thursday, December 9, 2010
Data Governance (Part One)
This is the first of two articles introducing the concept of data governance.
Consultants and experts in the BI field use the terms “data governance” and “data integration” to talk about how to approach the kinds of problems we’ve been discussing in this section of the material. These fundamental concepts lie at the heart of the “integrated and coordinated” part of the definition we gave earlier for BI as a whole.
When we defined BI we said that both the data and the definitions of what the data mean need to be shared. “Data Governance” is the term that BI professionals use for the process of making sure that happens. This includes things like setting policies and procedures for how data are to be captured, processed, and stored, defining what terms like “revenue” mean for the purpose of making business decisions, defining what is acceptable for knowledge workers to do with data that are being used for decision purposes, and more. In short, what is being governed is the BI life cycle itself.
How data governance works depends mainly on the number of people with a stake in the process. In a small business, the owner may be the only person with a stake. So that owner will call the shots. In a larger business there may be many people of relatively equal clout with a stake in the governance process, and a significant amount of time and effort may need to be expended to make sure each voice is heard. In many larger companies today you may actually find a data governance board, made up of representatives of the IT and non-IT business units, whose mission it is to set corporate standards, policies and procedures for data governance.
Next time: The importance of top management buy-in for successful data governance.
Wednesday, December 8, 2010
Business Intelligence "Real" World Story #2
This is a true story. The names and addresses have been changed.
Once upon a time John Wilson bought a house at 2001 Elm Street from Joseph Wilson. The two Wilsons were not related to each other. It was a mere coincidence that they happened to have the same last name. Joseph Wilson, a retiree who was ready to downsize, moved into a smaller house nearby in the same postal (Zip) code. John Wilson, who had moved in from out of state, took up residence. Both men filed changes of address with the United States Postal Service (USPS). That was the end of their association, or so they thought.
Soon, John Wilson began to receive mail addressed to Joseph Wilson. At first he simply sent the pieces of mail back indicating “no such person at this address.” But all the mail addressed to Joseph Wilson kept coming back to John. For awhile John simply bundled up the mail every few days and took it over to Joseph, and found that Joseph was in turn receiving mail addressed to him. They hoped maybe it was temporary. But the problem persisted.
When John finally asked his letter carrier about it, the letter carrier explained that when USPS processed changes of address to figure out how to forward mail they used a unique identifier for each address. This identifier (called a “key” in data lingo) consisted of the first four letters of the last name plus the first four numbers of the street address. It looked like this: “WILS2001.” Since both men had the same last name and had been involved in a real estate transaction at the same address, and lived in the same Zip code, the USPS system in place at that time couldn’t tell what mail was meant for which person. The letter carrier apologized but said there was nothing he could do.
Almost ten years later, John Wilson, who has since moved twice more, still receives mail addressed to Joseph Wilson, who sadly is now deceased.
Tuesday, December 7, 2010
Drill Down On: Capturing and Processing Data
Previously, we touched on the Capture and Process stages of the BI data life-cycle. This article begins a more in-depth look at these two stages.
When we introduced the concept of BI we put it in the context of a life cycle. The first two steps of the life cycle we defined as capturing and processing data. These two pieces are tied together because the better job we can do in the first step of capturing data, the less work we have to do in the second step of processing it for consumption (which is the third step in our life cycle). All of that sounds wonderful, but it’s never as easy as it sounds, and the bigger a business becomes the more difficult it gets to capture and process the data smoothly.
To illustrate what we’re talking about, think about a specialty retail store. When the store first opens for business, let’s say it starts out with a cash register or point of sale (POS) terminal. If the specialty items that the store sells are rare or interesting enough, in time word will spread beyond the local community in which the store operates. The store owner may create a presence on a social networking site such as Facebook and begin seeing demand from other parts of the country or even the world. This may lead to the creation of an e-commerce web site.
Soon there are sales coming from two sources (one online, the other in-store). While most of the online customers are not local customers, some of them may be. As the business grows bigger and bigger it becomes harder to tell which is which. You may end up with an account for the same customer on each of your sales systems.
This may happen even with just one system, if you’re not very careful about how you set it up and train the people who run the system. For example, an existing customer named Jones wants to buy something. The clerk does a search for “JONES.” Nothing comes up, so the clerk sets up a new account. Nothing came up in the search because the POS system is case-sensitive. So now you have Mr. Jones twice. Good luck later when you try to figure out if he’s a good customer or not.
Next time: A sad but true tale from the "real" world.
Monday, December 6, 2010
BI Data Life-Cycle: Archive
This is the last article of a series that introduced and discusses a life-cycle model for business intelligence (BI) data.
In an earlier article we compared the raw material we process into finished goods to the raw data we process and consume as part of the BI process. The finished product that a factory turns out has a useful life of some number of years. At some point, one of two things happens. Either the product breaks down and is cheaper to scrap than to repair, or a new product makes the old one obsolete. Of course it doesn’t work out that way every time; just think of the thousands of ancient microwave ovens still humming away in break rooms across America.
The same thing that is true with products is true with data. At some point, the data become “stale.” Changing market conditions make the numbers obsolete. But some numbers stay relevant longer. Generally speaking, the higher the aggregation level of the number, the longer it stays relevant. For example, you’ll want to know your total sales and net profit for the whole company going back several years long after a specific product you may have sold back then is off the market. The temptation may be to just delete the old data. But in this age of cheap storage, I would suggest archiving it. You won’t need to use the old data on a daily basis and you probably won’t miss it much. But if you ever need to go back it to do historical research you can.
Friday, December 3, 2010
BI Data Life-Cycle: Consume
This is the latest in a series of articles discussing the life-cycle of business intelligence (BI) data. We've been discussing a model with four main stages: Capture, Process, Consume, and Archive. This article introduces consumption of the data.
Once we have the processed our raw data, we’re ready to interact with it in order to try to understand what’s going on with our business. This step of the process, the actual interaction with and consumption of our data, is what most people think of as business intelligence, if they think of it at all. How you consume the data depends on a number of different things: the size of your business, your stake in that business, and the kinds of questions you want to answer.
If your business is small or you run a small business unit in a bigger company, you’re probably intimately involved with your data at a pretty detailed level. For one thing, you’re probably out there in the trenches with your customers every day. You need to know things like your costs and margins so that you can make quick adjustments in negotiations. For another thing, you probably can’t afford a dedicated analyst at this stage. On the other hand, if you’re in a bigger business, there’s probably more of a division of labor between the higher-level managers and the knowledge workers (whom the managers can probably now afford). The boss doesn’t want to be intimately involved in the gory details, and if you’re the knowledge worker you probably don’t want him or her to be intimately involved either.
The kind of stake you hold in the business also has a lot to do with how you consume the data. The general rule here is: the higher you are in the organization, or the farther away you are from it, the less detail you need. All shareholders usually want or need is what they get in the quarterly and annual reports released by a corporation. These are mainly static reports about things like profit and loss and changes in cash flow. The corporation’s board of directors really doesn’t need much more than that; mainly the board needs sufficient data at a high level to help the directors determine whether the business strategy they approved is working or not. The CEO needs a little more detail, and the different business unit managers need still more detail about their units, and so it goes.
As you become more comfortable with your data you may find that you want to ask more and different kinds of questions. Everyone starts out with “how much did we make last month?” but that’s just the tip of the iceberg, so to speak. To really understand your business you’ll eventually start to ask more complicated things like:
• Who are our best customers?
• Where do our sales really come from?
• What are our most profitable product offerings?
• Which products should we discontinue?
• How do we get the most out of our advertising dollars?
• . . . and a host of others
What we’ll see is that we consume data differently depending on the kinds of questions we want to ask. Later, we’ll discuss at some length five main ways that we consume data and talk about the tools that are available for each type or class of data consumption.
Next we'll wrap up our discussion of the life-cycle with a word about archiving.
Thursday, December 2, 2010
BI Data Life-Cycle: Process
Previously, we introduced a model of the business intelligence (BI) life-cycle with four main stages: Capture, Process, Consume, and Archive. This article deals with the Process stage of the life-cycle.
Just as a factory processes raw material into items that consumers can use, the next step in our data life cycle processes the raw data we have captured into business intelligence data that business owners, managers and other knowledge workers can use. Depending on the size and complexity of the business, this may be as simple as getting the data from a print spool, reformatting it a little and loading it into something like a Microsoft Access database (think back to “Real-World Story #1”). Or it may require a much more industrial-strength solution, especially if the data are captured in many different places.
Why process the data in the first place? Remember the “integrated and coordinated” part of our definition of business intelligence. We want our data to be consistent and a major objective of the processing step is to make sure that we can compare apples to apples across every part of the business. And if you get that step right, it makes actually working with the data a lot easier down the line.
The next article introduces the heart of business intelligence, consuming the data.
Wednesday, December 1, 2010
BI Data Life-Cycle: Capture
Previously, I described a life-cycle of business intelligence data with four main stages: Capture, Process, Consume, and Archive. This article deals with the Capture stage of the cycle.
In some respects, a business treats data a lot like a factory treats raw material. And in order to do anything with the raw material you first have to get it. Let’s define “capture” as the process of getting raw data. How do we capture the data? The answer to that depends on how automated your business is. Our Old West general store owner from earlier in the chapter captured data in his sales ledger. Today, we might capture the same data in a point-of-sale (POS) terminal or from the Web if we do e-commerce. Or if we don’t do a lot of transactions, we may still issue a written receipt to the customer and then re-enter the data into a computer if we want to put it in electronic format. And of course, that’s not the only data we capture. We also capture data from purchase orders, shipping receipts, vendor invoices, tax forms, and many other sources.
Even though we don’t pay too much attention to data capture in the business intelligence processes that follow, it is still critical to BI. The reason for this is simple: if you don’t capture it in the beginning, you can’t analyze it later. Have you been to a retail store lately and as you go to check out, the sales clerk asks for your postal code? There may be any number of reasons for this. Maybe there are other stores nearby and they want to see if any of their markets are being over-served or under-served. Or maybe they want to see what postal codes their sales are coming from so they can better target mailings. (Or maybe they’re just nosy busybodies, but that’s probably not it. Probably not.) The key takeaway is this: if you want to analyze or report or mine the data (more about data mining later), you must capture it first.
Next time we'll discuss processing the captured data to prepare it for consumption.
Tuesday, November 30, 2010
WikiLeaks And Beyond: Is Business Intelligence Ready?
Spies without borders.
This is the new reality both governments and businesses face in the aftermath of the WikiLeaks disclosure of hundreds of thousands of classified U. S. military and diplomatic files. Julian Assange, founder of WikiLeaks, has taken hacking and whistle blowing to a new level by creating a truly independent intelligence agency. WikiLeaks owes no loyalty to any public or private organization, and this has governments worldwide losing sleep.
What does this have to do with business intelligence? Plenty. Mr. Assange, you see, isn't interested in just governments. He's coming after big business too, as he recently disclosed in an interview with Forbes. His vision, when you boil it down, is simple: a world without secrets. And this means greater danger to business intelligence data than ever before, especially for Fortune 1000 companies.
As I write this, pressure on WikiLeaks is mounting rapidly. It's quite possible that Mr. Assange will be closed down before long. But it doesn't end there. There are others who share his vision, even if they don't care for his (ironically) controlling management style. Indeed, some of these people started out with Mr. Assange and are talking about creating an alternative to his web site. WikiLeaks is only the beginning.
What this means for BI is that security will become an even higher priority than before, since BI data are among a company's most sensitive. But the danger isn't only lurking outside the firewall. The U. S. believes the damaging military leaks of spring 2010 resulted from the actions of a single private, who had access to the data from the inside. If you are in a small or medium size business you may not need the same sense of urgency - yet. But it's never too late to start thinking about the security of your BI data.
Spies without borders. They're coming. Is BI ready? Are you?
Introduction to the BI Data Life-Cycle
Business activity generally runs in cycles. For example, in manufacturing there is a cycle that begins when raw materials are received into a factory. Those raw materials are processed to create finished goods, and the finished goods are shipped out to customers. The next batch of raw materials is received, and the cycle goes on. To be sure, this is simplifying things a lot. But the basic idea of a production cycle is sound. In a similar way, there is a sort of production cycle with business intelligence data. Here’s a very simple graphic representation of what I mean.
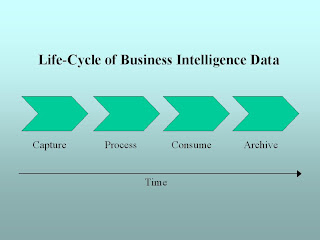
The middle two of the four components is where most business intelligence activity takes place, but all the components play a role in the cycle.
Next, we'll take a look at each of these components, beginning with Capture.

The middle two of the four components is where most business intelligence activity takes place, but all the components play a role in the cycle.
Next, we'll take a look at each of these components, beginning with Capture.
Monday, November 29, 2010
Business Intelligence "Real" World Story #1
Fairly early in my career I worked for a company that sold corporate-logo apparel to customer locations in the United States. Typically these customers were franchisees or retail outlets for large corporations, which were our “clients.” One of my duties, with help from an assistant, was to make sure our sales force got sales reports for the clients and customers in their territories. When I started, it worked like this: each Monday, our corporate head office sent us a sales report for the week just ended. It was sorted by customer location for each client. It was about the size of the USA’s 2010 health care bill, each week. It was printed on wide-ledger computer greenbar paper. Never heard of that? Lucky you. It took the better part of two days to go through this printout and put it in a format that had any meaning for the sales force. That meant that the week was half over (Wednesday) before they saw numbers for the previous week. Apparently this is how it had “always been done.”
I poked around at the process for awhile, and then I found out about a software tool called Monarch. This tool allowed you to take a formatted text or print spool file, and convert the contents into a form that could be easily loaded into a spreadsheet or a database on your PC. I struck a deal with a friend in the corporate IT department to leave the print spool file from the job that printed the sales report on the network for a while after it had finished printing. I would then download it, convert it using Monarch, and load the numbers into a database program called Paradox (all this was before Microsoft Office came to dominate the world). I wrote a report in Paradox that would add up and sort the data by client from highest sales to lowest. It wasn’t totally automated, but we were able to spit out more useful sales figures on the same day as IT put the sales out. And without realizing it, I had begun my BI career several years before it officially started.
Next time: an introduction to the business intelligence life-cycle.
Saturday, November 27, 2010
Should You Consider Open Source Business Intelligence?
If you're researching your options for implementing business intelligence, you may have run across the concept of open source business intelligence (OSBI). Is this a viable option for you?
What Exactly Does "Open Source" Mean?
Open Source simply means that the software developer has made the source code (all the computer language instructions that tell their software what to do and how to do it) freely available to the public for download. For the benefit of those who just want to use the software and not get into the code, they'll typically make the sofrware itself available for free download. But because the actual source code is available to anyone, developers all over the world can add to the software's capabilities.
If They're Giving It Away, How Do They Make Money?
They're not necessarily "giving it away." They're operating on a different business model.
Traditional software developers keep their code to themselves and charge you a license fee up front to use it. Typically as part of that deal they'll include maintenance (free upgrades and technical support) or they'll sell you those upgrades at a reduced rate (say, 10-15% of the original purchase price per year). When the next major release of the software comes out, they'll typically want to charge you a new license fee for that new release.
Open source developers, on the other hand, don't charge you a license fee up front. They typically make their money on the back end of the deal, especially by charging you for technical support, which includes things like help with installation and troubleshooting.
Is Open Source BI Software Any Good?
According to IT industry watcher Gartner, OSBI products have matured to a point where implementation is poised to increase rapidly over the next few years. Two of the names that are drawing a lot of attention are Pentaho and Jaspersoft.
Should I Consider OSBI Now?
If you have access to technical resources who can troubleshoot installation and other technical support issues, OSBI may be a huge cost saver for you over proprietary BI vendors. If you're on your own or have a thin IT staff, take the time to research exactly what your cost of ownership will be. Otherwise you risk being disappointed when you get what thought was "free" only to pay on the back end for support to get it running or, worse, end up feeling you wasted your time and starting over.
Friday, November 26, 2010
A "General" History (Part Two)
In the first part of this article, we described business intelligence, such as it was, in the days before computers and data processing were part of everyday life.
Time passed. Markets and populations grew. Manual data processing eventually got to be too slow. So automated data processing was introduced to speed up the pace at which business could be done. The first automated solutions were mechanical, such as cash registers and adding machines. Then along came electricity and computers, and the age of electronic data processing (EDP) dawned. Businesses could now process a much larger volume of transactions than before, making it easier to grow very rapidly.
But there was a downside. Once a company reaches a certain size it becomes too big for one person to manage off the top of his or her head as our general store owner did. There are employees to manage. There may be many stores in different parts of town, or in different countries. An item that was in stock just yesterday is suddenly gone from the shelf. With good bookkeeping you can figure out whether you’re making money or not. But you don’t necessarily know why, or even how, you’re making that money. Worst of all, you couldn’t get answers to these questions from the EDP systems. All you found out from them, if you found out anything, was that you did a whole bunch of transactions. There was a desperate need to get data out of these transaction-based systems and use them to make informed business decisions. As a matter of fact, the term “business intelligence” is often used interchangeably with the term “decision support.”
Next time: a story from the "real" world.
Thursday, November 25, 2010
Happy Thanksgiving!
If by some chance you took time out from the coffee and pumpkin pie to check and see if there was a new post on this blog today, then bless you! As it turned out I'm having coffee too (my son hogs the pie). I hope your holiday is peaceful and happy. Tomorrow we'll wrap up the "general" history of business intelligence.
Wednesday, November 24, 2010
A "General" History (Part One)
BI as it exists today grew out of the automated data processing revolution of the late 20th century. “Data” are simply facts about anything that interests us. We “process” the data in different ways and for different reasons, as we’ll discuss later. Before automated tools like computers were common, we were limited in how and how much data we could process.
In the Old West of United States history, the most common type of retail outlet, especially in small towns and outlying areas, was the “general store.” The general store was a one-stop shop for the staple items of the day. The salesperson that worked behind the counter may very well have owned the store. When you bought something, say a pound of coffee, the salesperson/owner would write the details of the business transaction down in a ledger. These might include who you are, what you bought and how much, as well as what you paid or (if you were fortunate enough to have a line of credit) what you owed. It was all done by hand with a pencil, but it was still data processing, and in the slower days of old it was more than sufficient.
Our general store owner had all the business intelligence he needed. He likely knew all of his customers by name, except for the occasional drifter with a fancy six-gun rig (but that’s another topic, not to mention another genre). He knew exactly what his financial position was by checking his cash box. If he wasn’t sure about his inventory status he just checked the storeroom out back.
Next time: The modern age of BI.
In the Old West of United States history, the most common type of retail outlet, especially in small towns and outlying areas, was the “general store.” The general store was a one-stop shop for the staple items of the day. The salesperson that worked behind the counter may very well have owned the store. When you bought something, say a pound of coffee, the salesperson/owner would write the details of the business transaction down in a ledger. These might include who you are, what you bought and how much, as well as what you paid or (if you were fortunate enough to have a line of credit) what you owed. It was all done by hand with a pencil, but it was still data processing, and in the slower days of old it was more than sufficient.
Jones, B., one lb. Coffee @ $ .01 – Paid in Full
Our general store owner had all the business intelligence he needed. He likely knew all of his customers by name, except for the occasional drifter with a fancy six-gun rig (but that’s another topic, not to mention another genre). He knew exactly what his financial position was by checking his cash box. If he wasn’t sure about his inventory status he just checked the storeroom out back.
Next time: The modern age of BI.
Tuesday, November 23, 2010
Business Intelligence Defined
Professional people in the BI world like to toss around acronyms and technical terms. I like to do that myself. But for most of my career I didn’t really have a good definition for what I was doing. When I would tell people what I did for a living I would focus on the technical parts. They would look at me as if I’d just arrived from a nearby star. So a few years ago I went looking for a useful definition of BI and found this:
Let’s look at a few important things in this definition.
First, successful BI is “integrated and coordinated.” Too often, in companies big and small, people in different business areas have their own little stashes of data that they don’t share with anyone else. Or if they do share, they don’t calculate their figures the same way anyone else does. How often have you heard the boss exclaim: “I wish I knew which of these sales figures is the right one!” How often have you been that boss? So both data and the definitions of what the data mean need to be shared.
Second, successful BI is “comprehensive.” This sort of follows from the “integrated and coordinated” part of the definition in the previous paragraph, but goes farther. The point of sharing data and the definitions for what the data mean is so that you can get the biggest and best possible picture of the whole business. The better you do this, the easier (and cheaper) it will be to understand how the different parts of the business fit together. This doesn’t mean you try to do it all at once, especially if you have time and budget constraints.
Lastly, successful BI is “long-term.” This means it’s not just a project that is done and checked off a list, and maybe you look at it again next quarter or next year. Business intelligence is a program that you commit to for the long haul the way you commit to quality or customer service. You don’t commit to those things? Okay, whatever. The fact that most businesses have to implement business intelligence incrementally, as we hinted at in the last paragraph, makes the long-term commitment aspect that much more important.
Next time: Business intelligence, the very unauthorized biography.
. . . the integrated and coordinated application of business information in order to comprehensively improve products, service, profits and the long-term health and growth of a company.
- Lee DeVries, "Improving Performance with the BI Quotient", DM Review, February 2007
Let’s look at a few important things in this definition.
First, successful BI is “integrated and coordinated.” Too often, in companies big and small, people in different business areas have their own little stashes of data that they don’t share with anyone else. Or if they do share, they don’t calculate their figures the same way anyone else does. How often have you heard the boss exclaim: “I wish I knew which of these sales figures is the right one!” How often have you been that boss? So both data and the definitions of what the data mean need to be shared.
Second, successful BI is “comprehensive.” This sort of follows from the “integrated and coordinated” part of the definition in the previous paragraph, but goes farther. The point of sharing data and the definitions for what the data mean is so that you can get the biggest and best possible picture of the whole business. The better you do this, the easier (and cheaper) it will be to understand how the different parts of the business fit together. This doesn’t mean you try to do it all at once, especially if you have time and budget constraints.
Lastly, successful BI is “long-term.” This means it’s not just a project that is done and checked off a list, and maybe you look at it again next quarter or next year. Business intelligence is a program that you commit to for the long haul the way you commit to quality or customer service. You don’t commit to those things? Okay, whatever. The fact that most businesses have to implement business intelligence incrementally, as we hinted at in the last paragraph, makes the long-term commitment aspect that much more important.
Next time: Business intelligence, the very unauthorized biography.
Monday, November 22, 2010
Microsoft Up To Its Old Tricks?
Microsoft has been tooting its horn lately about the latest new features coming out in it's next Dynamics GP release. Dynamics GP is a set of tools to help businesses with Enterprise Resource Planning (ERP) and Customer Relationship Management (CRM). ERP is about helping businesses plan out their requirements for money, material, and people. CRM is pretty much what it says, tools to help businesses manage their relationships with customers. So what does any of this have to do with BI?
One of the problems that some of the old line vendors in these businesses, companies like SAP, JD Edwards (now part of Oracle), and PeopleSoft, have faced is that customers quickly exhausted the basic reporting capabilities that came with these packages and ended up going out to look for BI tools to complement them. Different vendors have responded in different ways. For example, SAP bought Business Objects, which is one of the top BI software companies. They're trying to push Business Objects as an integrated (BI) solution to go with their ERP.
Microsoft, in classic style, is trying to head off the customer before he or she starts for the door. One of the big things they're touting in the coming release of Dynamics GP is the amount of business intelligence they're packing in to the product. This is basically the same thing they did with the desktop. Add functionality and call it part of the "operating system." By the time governments in and outside the US caught on to the scheme, it was a moot point. Microsoft had established dominance in the PC operating system market that has persisted to the present day. It'll be interesting to see how this ERP/CRM/BI mash-up plays out. Will Microsoft be able to provide sufficient BI capability in the Dynamics GP package to keep customers from looking elsewhere?
Sunday, November 21, 2010
Introducting Business Intelligence
This is a blog about business intelligence (BI). The idea of BI has been with us for some time, but the use of the term has only become popular since around the year 2000 or so. In this and the articles to follow we’ll define some terms, give a little background about how BI developed, and put BI in the larger context of the business by discussing the life cycle of BI data. In the fullness of time we’ll go into this life cycle in greater detail and lay out a strategy for implementing BI based on how human beings relate to data.
If you’ve come to this blog hoping to answer the question “what awesome tech tool should I use?” I’m afraid you’re going to be disappointed. The fact is that there are many tools in the marketplace and depending on your goals for business intelligence any of several of them could work for you. The purpose behind this blog is not to tell you what to buy, but to help you shape your goals and ask the right questions of potential employees, vendors, and consultants. Wherever I can I’ll try to give examples from my own experience to help you understand better. Of course the names will be changed to protect the innocent (namely me).
I am assuming that you, my reader, are not an information technology (IT) professional. I’m assuming you don’t know ETL from OLAP or ODS (fear not; we’ll get to those and other acronyms in due time). I hope that once we’re finished you’ll be, if not a card-carrying geek, at least knowledgeable enough to put BI to use in business, whether it’s your own or a business unit of your employer’s.
Next time, we'll give a definition of business intelligence that puts BI solidly in a business perspective.
Subscribe to:
Posts (Atom)