The previous material has introduced some basic BI concepts. The following list briefly summarizes what we’ve discussed over the past month or so.
1. BI data have a distinct lifecycle that consists of Capture, Processing, Consumption, and Archival.
2. The more accurately and precisely data are captured at the beginning of the lifecycle, the less work will need to be done in processing later.
3. BI data should be maintained separately from daily transaction data if at all possible.
4. Data integration and governance processes are critical to getting the most out of your firm’s business intelligence. These processes may be formal or informal, but ignore them at your peril.
5. The key to ensuring that steps 3 and 4 are executed properly is extraction, transformation, and loading of data (ETL) from the transaction system where the data are captured to the data warehouse or other data store where they will be consumed.
6. Your choices for consuming data are conditioned on the kinds of questions you want to ask and how you want to interact with the data.
7. Humans interact with data in one or more of five ways: producing, reviewing, investigating, monitoring, and extrapolating (PRIME).
8. Archival policy for BI data may be driven mainly by legal or tax considerations, but one may also wish to consider the strategic and time value (“freshness”) of the data.
Moving forward we'll be examining a number of business intelligence concepts and trends in more detail. Also, I'll be updating this blog a bit less frequently. I hope to post two to three times per week instead of Monday through Friday.
Showing posts with label basics. Show all posts
Showing posts with label basics. Show all posts
Wednesday, January 12, 2011

Tuesday, December 28, 2010
How We Interact With Data: The PRIME Model
Based on my experience and observations, I classify the way in which humans interact with data into five categories of activity:
Produce
This activity consists mainly of creating, updating, and transforming data and is the primary focus of the Capture and Process phases of the BI life-cycle.
Review
The focus of this activity is the passive consumption of static data.
Investigate
This activity involves a person drilling into or analyzing data in an effort to answer questions about one or more business processes represented by the data. Some of this activity may be automated through the use of data mining tools.
Monitor
I define monitoring as the exact opposite of reviewing; that is, active consumption of dynamic data. More on this later.
Extrapolate
Unlike other activities that focus on past results or present conditions, extrapolation attempts to predict future outcomes based on present conditions. The goal of this activity is to capitalize on potential future opportunities while avoiding or minimizing potential future threats.
Those of you who have poked into business intelligence before have probably run across a conceptual model that is different from this, in that it represents BI as a pyramid, like the following graph:
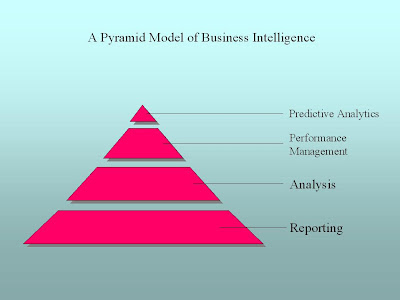
I like the PRIME approach over the pyramid approach for the following reasons:
1. There’s an implication that the higher you are on the pyramid the more sophisticated you are as a business intelligence operation. PRIME doesn’t care about that, but rather sticks to the activities involved so you can focus on the right tool for the activity.
2. Various manifestations of the pyramid approach tend to focus on applications like reporting, analysis, etc. As we’ll see, PRIME maps into these applications pretty well, but PRIME focuses on the activity rather than the application used for the activity.
Next, we’ll dig deeper into the activity categories of the PRIME model.
Next Topic: Produce
Produce
This activity consists mainly of creating, updating, and transforming data and is the primary focus of the Capture and Process phases of the BI life-cycle.
Review
The focus of this activity is the passive consumption of static data.
Investigate
This activity involves a person drilling into or analyzing data in an effort to answer questions about one or more business processes represented by the data. Some of this activity may be automated through the use of data mining tools.
Monitor
I define monitoring as the exact opposite of reviewing; that is, active consumption of dynamic data. More on this later.
Extrapolate
Unlike other activities that focus on past results or present conditions, extrapolation attempts to predict future outcomes based on present conditions. The goal of this activity is to capitalize on potential future opportunities while avoiding or minimizing potential future threats.
Those of you who have poked into business intelligence before have probably run across a conceptual model that is different from this, in that it represents BI as a pyramid, like the following graph:

I like the PRIME approach over the pyramid approach for the following reasons:
1. There’s an implication that the higher you are on the pyramid the more sophisticated you are as a business intelligence operation. PRIME doesn’t care about that, but rather sticks to the activities involved so you can focus on the right tool for the activity.
2. Various manifestations of the pyramid approach tend to focus on applications like reporting, analysis, etc. As we’ll see, PRIME maps into these applications pretty well, but PRIME focuses on the activity rather than the application used for the activity.
Next, we’ll dig deeper into the activity categories of the PRIME model.
Next Topic: Produce
Monday, December 27, 2010
Consuming Data: Introduction
Previously, we’ve discussed the first two stages in the business intelligence life-cycle, capture and processing. Once you’ve completed those steps and have data in your data warehouse or Microsoft Access database, what then? The answer to that question depends on the (1) questions you want to ask and (2) how you want to interact with the data.
The Questions I Want To Ask?
Well, duh, you say. But believe it or not, it seems to me that sometimes business people think the software is going to tell them everything they need to know without needing to ask. I remember as a kid watching the old “Batman” TV series. (Yes, it was first-run, not reruns; I am that old.) Whenever the Caped Crusader got stumped, he would feed the available data into the trusty “Bat Computer” and it would spit out the exact answer he needed. It seemed effortless, especially to a seven-year-old. (OK, I’m not that old!) Even the tools we have today for data mining and analytics aren’t as precise as the Bat Computer. So, although it may seem ridiculous you really do need to think about what kinds of questions you want to answer.
The more specific you can make your questions, the better off you’ll be. For example, “how are we doing this quarter?” isn’t really that great a question. A better question would be, “what are the trends of our sales and profit, for the quarter to date, quarter over quarter, and year over year?” If you’re already thinking in those terms, great! We’re ready to start thinking about how we interact with the data.
The Questions I Want To Ask?
Well, duh, you say. But believe it or not, it seems to me that sometimes business people think the software is going to tell them everything they need to know without needing to ask. I remember as a kid watching the old “Batman” TV series. (Yes, it was first-run, not reruns; I am that old.) Whenever the Caped Crusader got stumped, he would feed the available data into the trusty “Bat Computer” and it would spit out the exact answer he needed. It seemed effortless, especially to a seven-year-old. (OK, I’m not that old!) Even the tools we have today for data mining and analytics aren’t as precise as the Bat Computer. So, although it may seem ridiculous you really do need to think about what kinds of questions you want to answer.
The more specific you can make your questions, the better off you’ll be. For example, “how are we doing this quarter?” isn’t really that great a question. A better question would be, “what are the trends of our sales and profit, for the quarter to date, quarter over quarter, and year over year?” If you’re already thinking in those terms, great! We’re ready to start thinking about how we interact with the data.
Wednesday, December 15, 2010
Data Architecture 101
Someone who lays out the plan for a building is called an “architect.” The building plan as the architect lays it out is called the building’s “architecture.” In a similar way, we commonly call the layout of data for use by a business or other organization its “data architecture.”
The architecture of a building depends a lot on how the building is going to be used. For example, you wouldn’t expect an office building to be designed exactly the same as a factory or a grocery store. The same is true with data. The type of data architecture that works best to get a lot of data into a system, like a point of sale terminal, isn’t necessarily the best one to get the data out of that system. If you try to get the data out during business hours you risk slowing down the ongoing process of getting data in. The last thing you would want is to make a customer wait because you’re pulling a report from the same system you’re using to sell them something.
To make matters worse, consider what happens when, like our specialty retail store (for background see the article on the data integration imperative), you now have two different places where you have sales data (one in-store and one online). Now you have to pull sales reports from two different places. Do you want information by customer? Are you sure all the customers in the two systems are different? How do you know? Maybe you can just settle for sales by postal code, if you capture the postal code information in the store at the point of sale. And let’s hope the clerk (or you) didn’t fat-finger any of the Zip Codes. Of course, if you don’t have a choice you don’t have a choice. But this is why sooner or later growing businesses take a long look at data governance, data integration, and the data warehouse concept.
The architecture of a building depends a lot on how the building is going to be used. For example, you wouldn’t expect an office building to be designed exactly the same as a factory or a grocery store. The same is true with data. The type of data architecture that works best to get a lot of data into a system, like a point of sale terminal, isn’t necessarily the best one to get the data out of that system. If you try to get the data out during business hours you risk slowing down the ongoing process of getting data in. The last thing you would want is to make a customer wait because you’re pulling a report from the same system you’re using to sell them something.
To make matters worse, consider what happens when, like our specialty retail store (for background see the article on the data integration imperative), you now have two different places where you have sales data (one in-store and one online). Now you have to pull sales reports from two different places. Do you want information by customer? Are you sure all the customers in the two systems are different? How do you know? Maybe you can just settle for sales by postal code, if you capture the postal code information in the store at the point of sale. And let’s hope the clerk (or you) didn’t fat-finger any of the Zip Codes. Of course, if you don’t have a choice you don’t have a choice. But this is why sooner or later growing businesses take a long look at data governance, data integration, and the data warehouse concept.
Tuesday, December 14, 2010
About The Data Warehouse Concept
In recent articles we've been talking about data governance and data integration and why these are so important to your business. One of the key best practices for successful governance and integration is to keep business intelligence data separate from transaction data (such as the data in your accounting or point of sale systems).
Once you grow your business to the point where you need the concepts discussed here, you’ll probably want a technical guru to head up the implementation. Remember as we go that my idea is not to make you that guru, but to give you enough information to be an intelligent consumer of the products and services that make a sustainable BI program possible.
One very important principle behind that sustainable BI program is that we want a separate place for the data we’re going to consume, away from the sources from which we captured the data in the first place. Different people may give different names to this separate place. For our purposes right now let’s use the term “data warehouse.” This isn’t completely accurate, because the term “data warehouse” has a very specific meaning for BI professionals. So we’ll come back to this later.
But for now, as a simplification, we’ll say that we take data from where it was captured, do some processing with it, and load it into the data warehouse. There are good reasons for this. First, the systems designed to capture the data are not typically designed to get data out as easily as it gets in. Second, as we’ve hinted at previously there may be two or more sources of data that need to be combined in a way that is meaningful for your business.
Once you grow your business to the point where you need the concepts discussed here, you’ll probably want a technical guru to head up the implementation. Remember as we go that my idea is not to make you that guru, but to give you enough information to be an intelligent consumer of the products and services that make a sustainable BI program possible.
One very important principle behind that sustainable BI program is that we want a separate place for the data we’re going to consume, away from the sources from which we captured the data in the first place. Different people may give different names to this separate place. For our purposes right now let’s use the term “data warehouse.” This isn’t completely accurate, because the term “data warehouse” has a very specific meaning for BI professionals. So we’ll come back to this later.
But for now, as a simplification, we’ll say that we take data from where it was captured, do some processing with it, and load it into the data warehouse. There are good reasons for this. First, the systems designed to capture the data are not typically designed to get data out as easily as it gets in. Second, as we’ve hinted at previously there may be two or more sources of data that need to be combined in a way that is meaningful for your business.
Monday, December 13, 2010
The Data Integration Imperative
Consultants and experts in the BI field use the terms “data governance” and “data integration” to talk about how to approach the kinds of problems we’ve been discussing in this section of the material. These fundamental concepts lie at the heart of the “integrated and coordinated” part of the definition we gave earlier for BI as a whole. Previously, we introduced data governance in two articles. This article introduces the concept of data integration.
Whereas data governance (in my opinion, at least) is really a people concept that requires a human touch to manage properly, data integration is more a technical concept for implementing the parts of data governance policy that call for BI to reflect the business as a whole. Put another way, data integration is the activity of pulling together data from systems all over the business and tying it all together so it says something meaningful about the whole business.
If you’re just starting your own business, or you’re in a business unit of a company where there is little or no data governance in place, data integration is simply not a high priority. You may only have one set of data to work with, as was the case in “'Real' World Story #1.” In that case the output was meant strictly for internal consumption by the sales force. In the case of the fictional specialty retail store we discussed earlier, the only data available in the beginning might be point of sale data plus some cost data.
But as the business grows in size and data accumulate in more and different places, data integration becomes more and more important. As our specialty retail store develops, sales are collected both in the store and online. Also, there may now be shipping data sitting in a completely different place. Without some way of tying all of this together it becomes difficult to impossible to get the big picture of how the business is doing. So whether you need it or not to begin with, it’s never too early to start thinking about and planning for data integration in your business.
Whereas data governance (in my opinion, at least) is really a people concept that requires a human touch to manage properly, data integration is more a technical concept for implementing the parts of data governance policy that call for BI to reflect the business as a whole. Put another way, data integration is the activity of pulling together data from systems all over the business and tying it all together so it says something meaningful about the whole business.
If you’re just starting your own business, or you’re in a business unit of a company where there is little or no data governance in place, data integration is simply not a high priority. You may only have one set of data to work with, as was the case in “'Real' World Story #1.” In that case the output was meant strictly for internal consumption by the sales force. In the case of the fictional specialty retail store we discussed earlier, the only data available in the beginning might be point of sale data plus some cost data.
But as the business grows in size and data accumulate in more and different places, data integration becomes more and more important. As our specialty retail store develops, sales are collected both in the store and online. Also, there may now be shipping data sitting in a completely different place. Without some way of tying all of this together it becomes difficult to impossible to get the big picture of how the business is doing. So whether you need it or not to begin with, it’s never too early to start thinking about and planning for data integration in your business.
Friday, December 10, 2010
Data Governance (Part Two)
This is the second of two articles introducing the concept of data governance.
Now we’re going to introduce a theme that will return over and over again in different contexts throughout this blog: if you’re the boss, you need to be on board for any of this to work well. By “the boss” I mean the owner if it’s a small business, and a non-IT C-level executive (Chief Executive Officer, Chief Operating Officer, Chief Financial Officer in that order of preference) if it’s a larger business.
Why this order of preference? The CEO by definition has the most clout: typically the COO and Chief Information Officer (CIO) both report to her, and she can easily delegate responsibility for the data governance process jointly through them. The COO, having direct responsibility for day-to-day operations, is the next best choice. The CFO is more of a dicey choice because in most mature businesses IT grew up as an arm of finance and accounting and was later split off into a separate unit. Because of this, the relationship between IT and finance and accounting is often either too cozy (if the split was friendly) or too adversarial (if it wasn’t).
And why do we need the boss on board in the first place? Especially in larger companies, politics can play a huge role in the governance process. It’s only natural that stakeholders in the governance process will fight tooth and nail for the definitions, policies, and procedures that are most favorable to their business units. The boss needs to firmly and consistently champion the process as a whole, and to set guidance that places the overall business strategy for data governance above departmental politics.
Now we’re going to introduce a theme that will return over and over again in different contexts throughout this blog: if you’re the boss, you need to be on board for any of this to work well. By “the boss” I mean the owner if it’s a small business, and a non-IT C-level executive (Chief Executive Officer, Chief Operating Officer, Chief Financial Officer in that order of preference) if it’s a larger business.
Why this order of preference? The CEO by definition has the most clout: typically the COO and Chief Information Officer (CIO) both report to her, and she can easily delegate responsibility for the data governance process jointly through them. The COO, having direct responsibility for day-to-day operations, is the next best choice. The CFO is more of a dicey choice because in most mature businesses IT grew up as an arm of finance and accounting and was later split off into a separate unit. Because of this, the relationship between IT and finance and accounting is often either too cozy (if the split was friendly) or too adversarial (if it wasn’t).
And why do we need the boss on board in the first place? Especially in larger companies, politics can play a huge role in the governance process. It’s only natural that stakeholders in the governance process will fight tooth and nail for the definitions, policies, and procedures that are most favorable to their business units. The boss needs to firmly and consistently champion the process as a whole, and to set guidance that places the overall business strategy for data governance above departmental politics.
Thursday, December 9, 2010
Data Governance (Part One)
This is the first of two articles introducing the concept of data governance.
Consultants and experts in the BI field use the terms “data governance” and “data integration” to talk about how to approach the kinds of problems we’ve been discussing in this section of the material. These fundamental concepts lie at the heart of the “integrated and coordinated” part of the definition we gave earlier for BI as a whole.
When we defined BI we said that both the data and the definitions of what the data mean need to be shared. “Data Governance” is the term that BI professionals use for the process of making sure that happens. This includes things like setting policies and procedures for how data are to be captured, processed, and stored, defining what terms like “revenue” mean for the purpose of making business decisions, defining what is acceptable for knowledge workers to do with data that are being used for decision purposes, and more. In short, what is being governed is the BI life cycle itself.
How data governance works depends mainly on the number of people with a stake in the process. In a small business, the owner may be the only person with a stake. So that owner will call the shots. In a larger business there may be many people of relatively equal clout with a stake in the governance process, and a significant amount of time and effort may need to be expended to make sure each voice is heard. In many larger companies today you may actually find a data governance board, made up of representatives of the IT and non-IT business units, whose mission it is to set corporate standards, policies and procedures for data governance.
Next time: The importance of top management buy-in for successful data governance.
Consultants and experts in the BI field use the terms “data governance” and “data integration” to talk about how to approach the kinds of problems we’ve been discussing in this section of the material. These fundamental concepts lie at the heart of the “integrated and coordinated” part of the definition we gave earlier for BI as a whole.
When we defined BI we said that both the data and the definitions of what the data mean need to be shared. “Data Governance” is the term that BI professionals use for the process of making sure that happens. This includes things like setting policies and procedures for how data are to be captured, processed, and stored, defining what terms like “revenue” mean for the purpose of making business decisions, defining what is acceptable for knowledge workers to do with data that are being used for decision purposes, and more. In short, what is being governed is the BI life cycle itself.
How data governance works depends mainly on the number of people with a stake in the process. In a small business, the owner may be the only person with a stake. So that owner will call the shots. In a larger business there may be many people of relatively equal clout with a stake in the governance process, and a significant amount of time and effort may need to be expended to make sure each voice is heard. In many larger companies today you may actually find a data governance board, made up of representatives of the IT and non-IT business units, whose mission it is to set corporate standards, policies and procedures for data governance.
Next time: The importance of top management buy-in for successful data governance.
Monday, December 6, 2010
BI Data Life-Cycle: Archive
This is the last article of a series that introduced and discusses a life-cycle model for business intelligence (BI) data.
In an earlier article we compared the raw material we process into finished goods to the raw data we process and consume as part of the BI process. The finished product that a factory turns out has a useful life of some number of years. At some point, one of two things happens. Either the product breaks down and is cheaper to scrap than to repair, or a new product makes the old one obsolete. Of course it doesn’t work out that way every time; just think of the thousands of ancient microwave ovens still humming away in break rooms across America.
The same thing that is true with products is true with data. At some point, the data become “stale.” Changing market conditions make the numbers obsolete. But some numbers stay relevant longer. Generally speaking, the higher the aggregation level of the number, the longer it stays relevant. For example, you’ll want to know your total sales and net profit for the whole company going back several years long after a specific product you may have sold back then is off the market. The temptation may be to just delete the old data. But in this age of cheap storage, I would suggest archiving it. You won’t need to use the old data on a daily basis and you probably won’t miss it much. But if you ever need to go back it to do historical research you can.
In an earlier article we compared the raw material we process into finished goods to the raw data we process and consume as part of the BI process. The finished product that a factory turns out has a useful life of some number of years. At some point, one of two things happens. Either the product breaks down and is cheaper to scrap than to repair, or a new product makes the old one obsolete. Of course it doesn’t work out that way every time; just think of the thousands of ancient microwave ovens still humming away in break rooms across America.
The same thing that is true with products is true with data. At some point, the data become “stale.” Changing market conditions make the numbers obsolete. But some numbers stay relevant longer. Generally speaking, the higher the aggregation level of the number, the longer it stays relevant. For example, you’ll want to know your total sales and net profit for the whole company going back several years long after a specific product you may have sold back then is off the market. The temptation may be to just delete the old data. But in this age of cheap storage, I would suggest archiving it. You won’t need to use the old data on a daily basis and you probably won’t miss it much. But if you ever need to go back it to do historical research you can.
Friday, December 3, 2010
BI Data Life-Cycle: Consume
This is the latest in a series of articles discussing the life-cycle of business intelligence (BI) data. We've been discussing a model with four main stages: Capture, Process, Consume, and Archive. This article introduces consumption of the data.
Once we have the processed our raw data, we’re ready to interact with it in order to try to understand what’s going on with our business. This step of the process, the actual interaction with and consumption of our data, is what most people think of as business intelligence, if they think of it at all. How you consume the data depends on a number of different things: the size of your business, your stake in that business, and the kinds of questions you want to answer.
If your business is small or you run a small business unit in a bigger company, you’re probably intimately involved with your data at a pretty detailed level. For one thing, you’re probably out there in the trenches with your customers every day. You need to know things like your costs and margins so that you can make quick adjustments in negotiations. For another thing, you probably can’t afford a dedicated analyst at this stage. On the other hand, if you’re in a bigger business, there’s probably more of a division of labor between the higher-level managers and the knowledge workers (whom the managers can probably now afford). The boss doesn’t want to be intimately involved in the gory details, and if you’re the knowledge worker you probably don’t want him or her to be intimately involved either.
The kind of stake you hold in the business also has a lot to do with how you consume the data. The general rule here is: the higher you are in the organization, or the farther away you are from it, the less detail you need. All shareholders usually want or need is what they get in the quarterly and annual reports released by a corporation. These are mainly static reports about things like profit and loss and changes in cash flow. The corporation’s board of directors really doesn’t need much more than that; mainly the board needs sufficient data at a high level to help the directors determine whether the business strategy they approved is working or not. The CEO needs a little more detail, and the different business unit managers need still more detail about their units, and so it goes.
As you become more comfortable with your data you may find that you want to ask more and different kinds of questions. Everyone starts out with “how much did we make last month?” but that’s just the tip of the iceberg, so to speak. To really understand your business you’ll eventually start to ask more complicated things like:
• Who are our best customers?
• Where do our sales really come from?
• What are our most profitable product offerings?
• Which products should we discontinue?
• How do we get the most out of our advertising dollars?
• . . . and a host of others
What we’ll see is that we consume data differently depending on the kinds of questions we want to ask. Later, we’ll discuss at some length five main ways that we consume data and talk about the tools that are available for each type or class of data consumption.
Next we'll wrap up our discussion of the life-cycle with a word about archiving.
Once we have the processed our raw data, we’re ready to interact with it in order to try to understand what’s going on with our business. This step of the process, the actual interaction with and consumption of our data, is what most people think of as business intelligence, if they think of it at all. How you consume the data depends on a number of different things: the size of your business, your stake in that business, and the kinds of questions you want to answer.
If your business is small or you run a small business unit in a bigger company, you’re probably intimately involved with your data at a pretty detailed level. For one thing, you’re probably out there in the trenches with your customers every day. You need to know things like your costs and margins so that you can make quick adjustments in negotiations. For another thing, you probably can’t afford a dedicated analyst at this stage. On the other hand, if you’re in a bigger business, there’s probably more of a division of labor between the higher-level managers and the knowledge workers (whom the managers can probably now afford). The boss doesn’t want to be intimately involved in the gory details, and if you’re the knowledge worker you probably don’t want him or her to be intimately involved either.
The kind of stake you hold in the business also has a lot to do with how you consume the data. The general rule here is: the higher you are in the organization, or the farther away you are from it, the less detail you need. All shareholders usually want or need is what they get in the quarterly and annual reports released by a corporation. These are mainly static reports about things like profit and loss and changes in cash flow. The corporation’s board of directors really doesn’t need much more than that; mainly the board needs sufficient data at a high level to help the directors determine whether the business strategy they approved is working or not. The CEO needs a little more detail, and the different business unit managers need still more detail about their units, and so it goes.
As you become more comfortable with your data you may find that you want to ask more and different kinds of questions. Everyone starts out with “how much did we make last month?” but that’s just the tip of the iceberg, so to speak. To really understand your business you’ll eventually start to ask more complicated things like:
• Who are our best customers?
• Where do our sales really come from?
• What are our most profitable product offerings?
• Which products should we discontinue?
• How do we get the most out of our advertising dollars?
• . . . and a host of others
What we’ll see is that we consume data differently depending on the kinds of questions we want to ask. Later, we’ll discuss at some length five main ways that we consume data and talk about the tools that are available for each type or class of data consumption.
Next we'll wrap up our discussion of the life-cycle with a word about archiving.
Thursday, December 2, 2010
BI Data Life-Cycle: Process
Previously, we introduced a model of the business intelligence (BI) life-cycle with four main stages: Capture, Process, Consume, and Archive. This article deals with the Process stage of the life-cycle.
Just as a factory processes raw material into items that consumers can use, the next step in our data life cycle processes the raw data we have captured into business intelligence data that business owners, managers and other knowledge workers can use. Depending on the size and complexity of the business, this may be as simple as getting the data from a print spool, reformatting it a little and loading it into something like a Microsoft Access database (think back to “Real-World Story #1”). Or it may require a much more industrial-strength solution, especially if the data are captured in many different places.
Why process the data in the first place? Remember the “integrated and coordinated” part of our definition of business intelligence. We want our data to be consistent and a major objective of the processing step is to make sure that we can compare apples to apples across every part of the business. And if you get that step right, it makes actually working with the data a lot easier down the line.
The next article introduces the heart of business intelligence, consuming the data.
Just as a factory processes raw material into items that consumers can use, the next step in our data life cycle processes the raw data we have captured into business intelligence data that business owners, managers and other knowledge workers can use. Depending on the size and complexity of the business, this may be as simple as getting the data from a print spool, reformatting it a little and loading it into something like a Microsoft Access database (think back to “Real-World Story #1”). Or it may require a much more industrial-strength solution, especially if the data are captured in many different places.
Why process the data in the first place? Remember the “integrated and coordinated” part of our definition of business intelligence. We want our data to be consistent and a major objective of the processing step is to make sure that we can compare apples to apples across every part of the business. And if you get that step right, it makes actually working with the data a lot easier down the line.
The next article introduces the heart of business intelligence, consuming the data.
Wednesday, December 1, 2010
BI Data Life-Cycle: Capture
Previously, I described a life-cycle of business intelligence data with four main stages: Capture, Process, Consume, and Archive. This article deals with the Capture stage of the cycle.
In some respects, a business treats data a lot like a factory treats raw material. And in order to do anything with the raw material you first have to get it. Let’s define “capture” as the process of getting raw data. How do we capture the data? The answer to that depends on how automated your business is. Our Old West general store owner from earlier in the chapter captured data in his sales ledger. Today, we might capture the same data in a point-of-sale (POS) terminal or from the Web if we do e-commerce. Or if we don’t do a lot of transactions, we may still issue a written receipt to the customer and then re-enter the data into a computer if we want to put it in electronic format. And of course, that’s not the only data we capture. We also capture data from purchase orders, shipping receipts, vendor invoices, tax forms, and many other sources.
Even though we don’t pay too much attention to data capture in the business intelligence processes that follow, it is still critical to BI. The reason for this is simple: if you don’t capture it in the beginning, you can’t analyze it later. Have you been to a retail store lately and as you go to check out, the sales clerk asks for your postal code? There may be any number of reasons for this. Maybe there are other stores nearby and they want to see if any of their markets are being over-served or under-served. Or maybe they want to see what postal codes their sales are coming from so they can better target mailings. (Or maybe they’re just nosy busybodies, but that’s probably not it. Probably not.) The key takeaway is this: if you want to analyze or report or mine the data (more about data mining later), you must capture it first.
Next time we'll discuss processing the captured data to prepare it for consumption.
In some respects, a business treats data a lot like a factory treats raw material. And in order to do anything with the raw material you first have to get it. Let’s define “capture” as the process of getting raw data. How do we capture the data? The answer to that depends on how automated your business is. Our Old West general store owner from earlier in the chapter captured data in his sales ledger. Today, we might capture the same data in a point-of-sale (POS) terminal or from the Web if we do e-commerce. Or if we don’t do a lot of transactions, we may still issue a written receipt to the customer and then re-enter the data into a computer if we want to put it in electronic format. And of course, that’s not the only data we capture. We also capture data from purchase orders, shipping receipts, vendor invoices, tax forms, and many other sources.
Even though we don’t pay too much attention to data capture in the business intelligence processes that follow, it is still critical to BI. The reason for this is simple: if you don’t capture it in the beginning, you can’t analyze it later. Have you been to a retail store lately and as you go to check out, the sales clerk asks for your postal code? There may be any number of reasons for this. Maybe there are other stores nearby and they want to see if any of their markets are being over-served or under-served. Or maybe they want to see what postal codes their sales are coming from so they can better target mailings. (Or maybe they’re just nosy busybodies, but that’s probably not it. Probably not.) The key takeaway is this: if you want to analyze or report or mine the data (more about data mining later), you must capture it first.
Next time we'll discuss processing the captured data to prepare it for consumption.
Tuesday, November 30, 2010
Introduction to the BI Data Life-Cycle
Business activity generally runs in cycles. For example, in manufacturing there is a cycle that begins when raw materials are received into a factory. Those raw materials are processed to create finished goods, and the finished goods are shipped out to customers. The next batch of raw materials is received, and the cycle goes on. To be sure, this is simplifying things a lot. But the basic idea of a production cycle is sound. In a similar way, there is a sort of production cycle with business intelligence data. Here’s a very simple graphic representation of what I mean.
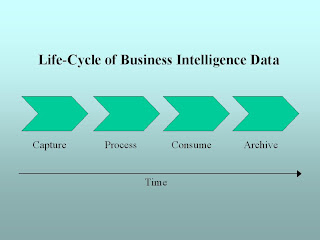
The middle two of the four components is where most business intelligence activity takes place, but all the components play a role in the cycle.
Next, we'll take a look at each of these components, beginning with Capture.

The middle two of the four components is where most business intelligence activity takes place, but all the components play a role in the cycle.
Next, we'll take a look at each of these components, beginning with Capture.
Monday, November 29, 2010
Business Intelligence "Real" World Story #1
Fairly early in my career I worked for a company that sold corporate-logo apparel to customer locations in the United States. Typically these customers were franchisees or retail outlets for large corporations, which were our “clients.” One of my duties, with help from an assistant, was to make sure our sales force got sales reports for the clients and customers in their territories. When I started, it worked like this: each Monday, our corporate head office sent us a sales report for the week just ended. It was sorted by customer location for each client. It was about the size of the USA’s 2010 health care bill, each week. It was printed on wide-ledger computer greenbar paper. Never heard of that? Lucky you. It took the better part of two days to go through this printout and put it in a format that had any meaning for the sales force. That meant that the week was half over (Wednesday) before they saw numbers for the previous week. Apparently this is how it had “always been done.”
I poked around at the process for awhile, and then I found out about a software tool called Monarch. This tool allowed you to take a formatted text or print spool file, and convert the contents into a form that could be easily loaded into a spreadsheet or a database on your PC. I struck a deal with a friend in the corporate IT department to leave the print spool file from the job that printed the sales report on the network for a while after it had finished printing. I would then download it, convert it using Monarch, and load the numbers into a database program called Paradox (all this was before Microsoft Office came to dominate the world). I wrote a report in Paradox that would add up and sort the data by client from highest sales to lowest. It wasn’t totally automated, but we were able to spit out more useful sales figures on the same day as IT put the sales out. And without realizing it, I had begun my BI career several years before it officially started.
Next time: an introduction to the business intelligence life-cycle.
I poked around at the process for awhile, and then I found out about a software tool called Monarch. This tool allowed you to take a formatted text or print spool file, and convert the contents into a form that could be easily loaded into a spreadsheet or a database on your PC. I struck a deal with a friend in the corporate IT department to leave the print spool file from the job that printed the sales report on the network for a while after it had finished printing. I would then download it, convert it using Monarch, and load the numbers into a database program called Paradox (all this was before Microsoft Office came to dominate the world). I wrote a report in Paradox that would add up and sort the data by client from highest sales to lowest. It wasn’t totally automated, but we were able to spit out more useful sales figures on the same day as IT put the sales out. And without realizing it, I had begun my BI career several years before it officially started.
Next time: an introduction to the business intelligence life-cycle.
Friday, November 26, 2010
A "General" History (Part Two)
In the first part of this article, we described business intelligence, such as it was, in the days before computers and data processing were part of everyday life.
Time passed. Markets and populations grew. Manual data processing eventually got to be too slow. So automated data processing was introduced to speed up the pace at which business could be done. The first automated solutions were mechanical, such as cash registers and adding machines. Then along came electricity and computers, and the age of electronic data processing (EDP) dawned. Businesses could now process a much larger volume of transactions than before, making it easier to grow very rapidly.
But there was a downside. Once a company reaches a certain size it becomes too big for one person to manage off the top of his or her head as our general store owner did. There are employees to manage. There may be many stores in different parts of town, or in different countries. An item that was in stock just yesterday is suddenly gone from the shelf. With good bookkeeping you can figure out whether you’re making money or not. But you don’t necessarily know why, or even how, you’re making that money. Worst of all, you couldn’t get answers to these questions from the EDP systems. All you found out from them, if you found out anything, was that you did a whole bunch of transactions. There was a desperate need to get data out of these transaction-based systems and use them to make informed business decisions. As a matter of fact, the term “business intelligence” is often used interchangeably with the term “decision support.”
Next time: a story from the "real" world.
Time passed. Markets and populations grew. Manual data processing eventually got to be too slow. So automated data processing was introduced to speed up the pace at which business could be done. The first automated solutions were mechanical, such as cash registers and adding machines. Then along came electricity and computers, and the age of electronic data processing (EDP) dawned. Businesses could now process a much larger volume of transactions than before, making it easier to grow very rapidly.
But there was a downside. Once a company reaches a certain size it becomes too big for one person to manage off the top of his or her head as our general store owner did. There are employees to manage. There may be many stores in different parts of town, or in different countries. An item that was in stock just yesterday is suddenly gone from the shelf. With good bookkeeping you can figure out whether you’re making money or not. But you don’t necessarily know why, or even how, you’re making that money. Worst of all, you couldn’t get answers to these questions from the EDP systems. All you found out from them, if you found out anything, was that you did a whole bunch of transactions. There was a desperate need to get data out of these transaction-based systems and use them to make informed business decisions. As a matter of fact, the term “business intelligence” is often used interchangeably with the term “decision support.”
Next time: a story from the "real" world.
Wednesday, November 24, 2010
A "General" History (Part One)
BI as it exists today grew out of the automated data processing revolution of the late 20th century. “Data” are simply facts about anything that interests us. We “process” the data in different ways and for different reasons, as we’ll discuss later. Before automated tools like computers were common, we were limited in how and how much data we could process.
In the Old West of United States history, the most common type of retail outlet, especially in small towns and outlying areas, was the “general store.” The general store was a one-stop shop for the staple items of the day. The salesperson that worked behind the counter may very well have owned the store. When you bought something, say a pound of coffee, the salesperson/owner would write the details of the business transaction down in a ledger. These might include who you are, what you bought and how much, as well as what you paid or (if you were fortunate enough to have a line of credit) what you owed. It was all done by hand with a pencil, but it was still data processing, and in the slower days of old it was more than sufficient.
Our general store owner had all the business intelligence he needed. He likely knew all of his customers by name, except for the occasional drifter with a fancy six-gun rig (but that’s another topic, not to mention another genre). He knew exactly what his financial position was by checking his cash box. If he wasn’t sure about his inventory status he just checked the storeroom out back.
Next time: The modern age of BI.
In the Old West of United States history, the most common type of retail outlet, especially in small towns and outlying areas, was the “general store.” The general store was a one-stop shop for the staple items of the day. The salesperson that worked behind the counter may very well have owned the store. When you bought something, say a pound of coffee, the salesperson/owner would write the details of the business transaction down in a ledger. These might include who you are, what you bought and how much, as well as what you paid or (if you were fortunate enough to have a line of credit) what you owed. It was all done by hand with a pencil, but it was still data processing, and in the slower days of old it was more than sufficient.
Jones, B., one lb. Coffee @ $ .01 – Paid in Full
Our general store owner had all the business intelligence he needed. He likely knew all of his customers by name, except for the occasional drifter with a fancy six-gun rig (but that’s another topic, not to mention another genre). He knew exactly what his financial position was by checking his cash box. If he wasn’t sure about his inventory status he just checked the storeroom out back.
Next time: The modern age of BI.
Tuesday, November 23, 2010
Business Intelligence Defined
Professional people in the BI world like to toss around acronyms and technical terms. I like to do that myself. But for most of my career I didn’t really have a good definition for what I was doing. When I would tell people what I did for a living I would focus on the technical parts. They would look at me as if I’d just arrived from a nearby star. So a few years ago I went looking for a useful definition of BI and found this:
Let’s look at a few important things in this definition.
First, successful BI is “integrated and coordinated.” Too often, in companies big and small, people in different business areas have their own little stashes of data that they don’t share with anyone else. Or if they do share, they don’t calculate their figures the same way anyone else does. How often have you heard the boss exclaim: “I wish I knew which of these sales figures is the right one!” How often have you been that boss? So both data and the definitions of what the data mean need to be shared.
Second, successful BI is “comprehensive.” This sort of follows from the “integrated and coordinated” part of the definition in the previous paragraph, but goes farther. The point of sharing data and the definitions for what the data mean is so that you can get the biggest and best possible picture of the whole business. The better you do this, the easier (and cheaper) it will be to understand how the different parts of the business fit together. This doesn’t mean you try to do it all at once, especially if you have time and budget constraints.
Lastly, successful BI is “long-term.” This means it’s not just a project that is done and checked off a list, and maybe you look at it again next quarter or next year. Business intelligence is a program that you commit to for the long haul the way you commit to quality or customer service. You don’t commit to those things? Okay, whatever. The fact that most businesses have to implement business intelligence incrementally, as we hinted at in the last paragraph, makes the long-term commitment aspect that much more important.
Next time: Business intelligence, the very unauthorized biography.
. . . the integrated and coordinated application of business information in order to comprehensively improve products, service, profits and the long-term health and growth of a company.
- Lee DeVries, "Improving Performance with the BI Quotient", DM Review, February 2007
Let’s look at a few important things in this definition.
First, successful BI is “integrated and coordinated.” Too often, in companies big and small, people in different business areas have their own little stashes of data that they don’t share with anyone else. Or if they do share, they don’t calculate their figures the same way anyone else does. How often have you heard the boss exclaim: “I wish I knew which of these sales figures is the right one!” How often have you been that boss? So both data and the definitions of what the data mean need to be shared.
Second, successful BI is “comprehensive.” This sort of follows from the “integrated and coordinated” part of the definition in the previous paragraph, but goes farther. The point of sharing data and the definitions for what the data mean is so that you can get the biggest and best possible picture of the whole business. The better you do this, the easier (and cheaper) it will be to understand how the different parts of the business fit together. This doesn’t mean you try to do it all at once, especially if you have time and budget constraints.
Lastly, successful BI is “long-term.” This means it’s not just a project that is done and checked off a list, and maybe you look at it again next quarter or next year. Business intelligence is a program that you commit to for the long haul the way you commit to quality or customer service. You don’t commit to those things? Okay, whatever. The fact that most businesses have to implement business intelligence incrementally, as we hinted at in the last paragraph, makes the long-term commitment aspect that much more important.
Next time: Business intelligence, the very unauthorized biography.
Sunday, November 21, 2010
Introducting Business Intelligence
This is a blog about business intelligence (BI). The idea of BI has been with us for some time, but the use of the term has only become popular since around the year 2000 or so. In this and the articles to follow we’ll define some terms, give a little background about how BI developed, and put BI in the larger context of the business by discussing the life cycle of BI data. In the fullness of time we’ll go into this life cycle in greater detail and lay out a strategy for implementing BI based on how human beings relate to data.
If you’ve come to this blog hoping to answer the question “what awesome tech tool should I use?” I’m afraid you’re going to be disappointed. The fact is that there are many tools in the marketplace and depending on your goals for business intelligence any of several of them could work for you. The purpose behind this blog is not to tell you what to buy, but to help you shape your goals and ask the right questions of potential employees, vendors, and consultants. Wherever I can I’ll try to give examples from my own experience to help you understand better. Of course the names will be changed to protect the innocent (namely me).
I am assuming that you, my reader, are not an information technology (IT) professional. I’m assuming you don’t know ETL from OLAP or ODS (fear not; we’ll get to those and other acronyms in due time). I hope that once we’re finished you’ll be, if not a card-carrying geek, at least knowledgeable enough to put BI to use in business, whether it’s your own or a business unit of your employer’s.
Next time, we'll give a definition of business intelligence that puts BI solidly in a business perspective.
If you’ve come to this blog hoping to answer the question “what awesome tech tool should I use?” I’m afraid you’re going to be disappointed. The fact is that there are many tools in the marketplace and depending on your goals for business intelligence any of several of them could work for you. The purpose behind this blog is not to tell you what to buy, but to help you shape your goals and ask the right questions of potential employees, vendors, and consultants. Wherever I can I’ll try to give examples from my own experience to help you understand better. Of course the names will be changed to protect the innocent (namely me).
I am assuming that you, my reader, are not an information technology (IT) professional. I’m assuming you don’t know ETL from OLAP or ODS (fear not; we’ll get to those and other acronyms in due time). I hope that once we’re finished you’ll be, if not a card-carrying geek, at least knowledgeable enough to put BI to use in business, whether it’s your own or a business unit of your employer’s.
Next time, we'll give a definition of business intelligence that puts BI solidly in a business perspective.
Subscribe to:
Posts (Atom)