Before consuming data in the business intelligence life-cycle, humans interact with data by producing it. This happens when they enter data into a transaction system, and it also happens in the Process stage of the life-cycle in cases where data from the transaction system are transformed to create new data prior to loading into the data warehouse or other BI data space. For more information about these processes, you can review the previous sections on “Capturing and Processing Data.”
But we also produce data as a result of other interactions we have with the data. Take the example of a knowledge worker who, in the process of analyzing accounting data, has an insight about what is going on with the business based on those data. In documenting that insight, the knowledge worker effectively creates or produces new data that did not previously exist. (Note that I could have used the word “create” for this activity, but the “CRIME” model just didn’t have the same ring to it.) In a similar fashion, an analyst working with data mining tools can use those tools to give previously unknown meaning to a hidden relationship he or she finds in data.
Even though the Produce category is not as pertinent as others in a discussion of consuming data, it is still an important component of the model and so I chose to include it with the rest of the model here rather than introducing the entire PRIME model in the earlier material on capturing and processing data.
Next Topic: Review
Showing posts with label processing. Show all posts
Showing posts with label processing. Show all posts
Wednesday, December 29, 2010

Tuesday, December 21, 2010
Processing Data For Business Intelligence (Part Two)
This article expands on concepts discussed in "Processing Data (Part One)." If you have not read that article, I suggest you do so before proceeding.
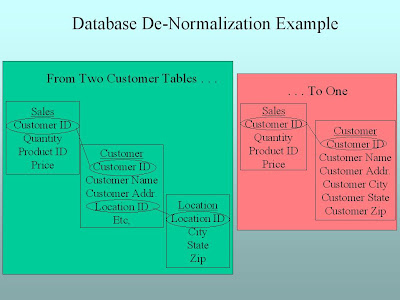
In the point-of-sale (POS) transaction system we’ve talked about previously, the database designer normalized customer data into two tables (one for Customer, one for Location) in order to avoid repeating city, state, and zip for each customer. When we process the data for consumption, we'll want to “denormalize” the data into a single table that puts all the location data together with the customer data. Why? By cutting down the number of tables we have to get data from, we make it quicker and easier to get data out of the database for reporting, analysis, and other kinds of business intelligence. When this process is complete, the database schema will most likely look like a star.
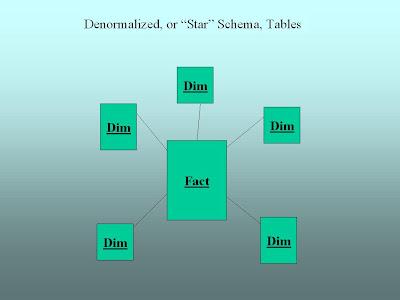
Notice that there are labels on each table. The central table is labeled “Fact.” In data warehouse parlance, the “fact” table contains information about business events that we want to measure. In our point-of-sale example our facts would probably be made up of the individual items our customer purchased on his or her visit to the store or web site. Each record in the fact table might look similar to the record we displayed when we discussed “Capturing Data” previously.
The tables around and connected to the fact table are labeled “Dim.” These represent what we’ll call “dimension” tables. When we talk about a dimension, we really just mean some aspect of the data that we’re interested in. In our point-of-sale example we’ve talked about Customers, Products, and Locations. All of these could be dimension tables in our data warehouse. Other dimensions might include Time (so we know when things are selling), Campaign (if we’re interested in knowing how the customer found us), and the list goes on and on. If this sounds a little confusing, think about how you want to look at your business. You might say to yourself, “I’d really like to see sales by customer by product by salesperson by month.” Each of these “bys” we listed off (Customer, Product, Salesperson, Month – or more generally Time) would be viable dimension candidates for our data warehouse. Sales would be our primary fact.
In the point-of-sale (POS) transaction system we’ve talked about previously, the database designer normalized customer data into two tables (one for Customer, one for Location) in order to avoid repeating city, state, and zip for each customer. When we process the data for consumption, we'll want to “denormalize” the data into a single table that puts all the location data together with the customer data. Why? By cutting down the number of tables we have to get data from, we make it quicker and easier to get data out of the database for reporting, analysis, and other kinds of business intelligence. When this process is complete, the database schema will most likely look like a star.

Notice that there are labels on each table. The central table is labeled “Fact.” In data warehouse parlance, the “fact” table contains information about business events that we want to measure. In our point-of-sale example our facts would probably be made up of the individual items our customer purchased on his or her visit to the store or web site. Each record in the fact table might look similar to the record we displayed when we discussed “Capturing Data” previously.
The tables around and connected to the fact table are labeled “Dim.” These represent what we’ll call “dimension” tables. When we talk about a dimension, we really just mean some aspect of the data that we’re interested in. In our point-of-sale example we’ve talked about Customers, Products, and Locations. All of these could be dimension tables in our data warehouse. Other dimensions might include Time (so we know when things are selling), Campaign (if we’re interested in knowing how the customer found us), and the list goes on and on. If this sounds a little confusing, think about how you want to look at your business. You might say to yourself, “I’d really like to see sales by customer by product by salesperson by month.” Each of these “bys” we listed off (Customer, Product, Salesperson, Month – or more generally Time) would be viable dimension candidates for our data warehouse. Sales would be our primary fact.
Monday, December 20, 2010
Processing Data For Business Intelligence (Part One)
In a previous article, we discussed how the data structure or schema that works best for getting data (like sales, customers, and products) into your transaction system doesn’t necessarily work the best for getting the data out. As we noted, there are two reasons for this. First, the descriptive data you need is spread across so many database tables it’s a pain to get at. Second, if you’re pulling the data while other people are using the system for processing (sales, for example) you risk bogging them and the business down. So what’s the solution?
The most efficient approach is to have a separate data space that is designed to make it easy to get data out for reporting, analysis, and other kinds of business intelligence. Depending on your company’s size and budget, this can be as big as a data warehouse that stores gigabytes or even terabytes of data in industrial-strength databases from IBM, Oracle, or Teradata. Or it could be as simple as a Microsoft Access database or even an Excel spreadsheet (we'll stop briefly here to give any technical gurus who may be eavesdropping a moment to recover). We’ll “process” the data from the transactional system (such as the point-of-sale system we’ve been using as an example) by dumping data out of it and loading it into the separate data space we’ll use for business intelligence.
One thing to note: the structure or schema of the database you use for consuming the data (the next step in the lifecycle following processing, where the meat of business intelligence takes place) will be different from the schema you use to capture it. How so? Remember that one of the problems with having that normalized data table structure was that there were so many tables to deal with. So when we process the data to get it ready for consumption, we’ll “denormalize” it. We see an example of this in the following graphic.
The most efficient approach is to have a separate data space that is designed to make it easy to get data out for reporting, analysis, and other kinds of business intelligence. Depending on your company’s size and budget, this can be as big as a data warehouse that stores gigabytes or even terabytes of data in industrial-strength databases from IBM, Oracle, or Teradata. Or it could be as simple as a Microsoft Access database or even an Excel spreadsheet (we'll stop briefly here to give any technical gurus who may be eavesdropping a moment to recover). We’ll “process” the data from the transactional system (such as the point-of-sale system we’ve been using as an example) by dumping data out of it and loading it into the separate data space we’ll use for business intelligence.
One thing to note: the structure or schema of the database you use for consuming the data (the next step in the lifecycle following processing, where the meat of business intelligence takes place) will be different from the schema you use to capture it. How so? Remember that one of the problems with having that normalized data table structure was that there were so many tables to deal with. So when we process the data to get it ready for consumption, we’ll “denormalize” it. We see an example of this in the following graphic.

Wednesday, December 15, 2010
Data Architecture 101
Someone who lays out the plan for a building is called an “architect.” The building plan as the architect lays it out is called the building’s “architecture.” In a similar way, we commonly call the layout of data for use by a business or other organization its “data architecture.”
The architecture of a building depends a lot on how the building is going to be used. For example, you wouldn’t expect an office building to be designed exactly the same as a factory or a grocery store. The same is true with data. The type of data architecture that works best to get a lot of data into a system, like a point of sale terminal, isn’t necessarily the best one to get the data out of that system. If you try to get the data out during business hours you risk slowing down the ongoing process of getting data in. The last thing you would want is to make a customer wait because you’re pulling a report from the same system you’re using to sell them something.
To make matters worse, consider what happens when, like our specialty retail store (for background see the article on the data integration imperative), you now have two different places where you have sales data (one in-store and one online). Now you have to pull sales reports from two different places. Do you want information by customer? Are you sure all the customers in the two systems are different? How do you know? Maybe you can just settle for sales by postal code, if you capture the postal code information in the store at the point of sale. And let’s hope the clerk (or you) didn’t fat-finger any of the Zip Codes. Of course, if you don’t have a choice you don’t have a choice. But this is why sooner or later growing businesses take a long look at data governance, data integration, and the data warehouse concept.
The architecture of a building depends a lot on how the building is going to be used. For example, you wouldn’t expect an office building to be designed exactly the same as a factory or a grocery store. The same is true with data. The type of data architecture that works best to get a lot of data into a system, like a point of sale terminal, isn’t necessarily the best one to get the data out of that system. If you try to get the data out during business hours you risk slowing down the ongoing process of getting data in. The last thing you would want is to make a customer wait because you’re pulling a report from the same system you’re using to sell them something.
To make matters worse, consider what happens when, like our specialty retail store (for background see the article on the data integration imperative), you now have two different places where you have sales data (one in-store and one online). Now you have to pull sales reports from two different places. Do you want information by customer? Are you sure all the customers in the two systems are different? How do you know? Maybe you can just settle for sales by postal code, if you capture the postal code information in the store at the point of sale. And let’s hope the clerk (or you) didn’t fat-finger any of the Zip Codes. Of course, if you don’t have a choice you don’t have a choice. But this is why sooner or later growing businesses take a long look at data governance, data integration, and the data warehouse concept.
Tuesday, December 14, 2010
About The Data Warehouse Concept
In recent articles we've been talking about data governance and data integration and why these are so important to your business. One of the key best practices for successful governance and integration is to keep business intelligence data separate from transaction data (such as the data in your accounting or point of sale systems).
Once you grow your business to the point where you need the concepts discussed here, you’ll probably want a technical guru to head up the implementation. Remember as we go that my idea is not to make you that guru, but to give you enough information to be an intelligent consumer of the products and services that make a sustainable BI program possible.
One very important principle behind that sustainable BI program is that we want a separate place for the data we’re going to consume, away from the sources from which we captured the data in the first place. Different people may give different names to this separate place. For our purposes right now let’s use the term “data warehouse.” This isn’t completely accurate, because the term “data warehouse” has a very specific meaning for BI professionals. So we’ll come back to this later.
But for now, as a simplification, we’ll say that we take data from where it was captured, do some processing with it, and load it into the data warehouse. There are good reasons for this. First, the systems designed to capture the data are not typically designed to get data out as easily as it gets in. Second, as we’ve hinted at previously there may be two or more sources of data that need to be combined in a way that is meaningful for your business.
Once you grow your business to the point where you need the concepts discussed here, you’ll probably want a technical guru to head up the implementation. Remember as we go that my idea is not to make you that guru, but to give you enough information to be an intelligent consumer of the products and services that make a sustainable BI program possible.
One very important principle behind that sustainable BI program is that we want a separate place for the data we’re going to consume, away from the sources from which we captured the data in the first place. Different people may give different names to this separate place. For our purposes right now let’s use the term “data warehouse.” This isn’t completely accurate, because the term “data warehouse” has a very specific meaning for BI professionals. So we’ll come back to this later.
But for now, as a simplification, we’ll say that we take data from where it was captured, do some processing with it, and load it into the data warehouse. There are good reasons for this. First, the systems designed to capture the data are not typically designed to get data out as easily as it gets in. Second, as we’ve hinted at previously there may be two or more sources of data that need to be combined in a way that is meaningful for your business.
Monday, December 13, 2010
The Data Integration Imperative
Consultants and experts in the BI field use the terms “data governance” and “data integration” to talk about how to approach the kinds of problems we’ve been discussing in this section of the material. These fundamental concepts lie at the heart of the “integrated and coordinated” part of the definition we gave earlier for BI as a whole. Previously, we introduced data governance in two articles. This article introduces the concept of data integration.
Whereas data governance (in my opinion, at least) is really a people concept that requires a human touch to manage properly, data integration is more a technical concept for implementing the parts of data governance policy that call for BI to reflect the business as a whole. Put another way, data integration is the activity of pulling together data from systems all over the business and tying it all together so it says something meaningful about the whole business.
If you’re just starting your own business, or you’re in a business unit of a company where there is little or no data governance in place, data integration is simply not a high priority. You may only have one set of data to work with, as was the case in “'Real' World Story #1.” In that case the output was meant strictly for internal consumption by the sales force. In the case of the fictional specialty retail store we discussed earlier, the only data available in the beginning might be point of sale data plus some cost data.
But as the business grows in size and data accumulate in more and different places, data integration becomes more and more important. As our specialty retail store develops, sales are collected both in the store and online. Also, there may now be shipping data sitting in a completely different place. Without some way of tying all of this together it becomes difficult to impossible to get the big picture of how the business is doing. So whether you need it or not to begin with, it’s never too early to start thinking about and planning for data integration in your business.
Whereas data governance (in my opinion, at least) is really a people concept that requires a human touch to manage properly, data integration is more a technical concept for implementing the parts of data governance policy that call for BI to reflect the business as a whole. Put another way, data integration is the activity of pulling together data from systems all over the business and tying it all together so it says something meaningful about the whole business.
If you’re just starting your own business, or you’re in a business unit of a company where there is little or no data governance in place, data integration is simply not a high priority. You may only have one set of data to work with, as was the case in “'Real' World Story #1.” In that case the output was meant strictly for internal consumption by the sales force. In the case of the fictional specialty retail store we discussed earlier, the only data available in the beginning might be point of sale data plus some cost data.
But as the business grows in size and data accumulate in more and different places, data integration becomes more and more important. As our specialty retail store develops, sales are collected both in the store and online. Also, there may now be shipping data sitting in a completely different place. Without some way of tying all of this together it becomes difficult to impossible to get the big picture of how the business is doing. So whether you need it or not to begin with, it’s never too early to start thinking about and planning for data integration in your business.
Friday, December 10, 2010
Data Governance (Part Two)
This is the second of two articles introducing the concept of data governance.
Now we’re going to introduce a theme that will return over and over again in different contexts throughout this blog: if you’re the boss, you need to be on board for any of this to work well. By “the boss” I mean the owner if it’s a small business, and a non-IT C-level executive (Chief Executive Officer, Chief Operating Officer, Chief Financial Officer in that order of preference) if it’s a larger business.
Why this order of preference? The CEO by definition has the most clout: typically the COO and Chief Information Officer (CIO) both report to her, and she can easily delegate responsibility for the data governance process jointly through them. The COO, having direct responsibility for day-to-day operations, is the next best choice. The CFO is more of a dicey choice because in most mature businesses IT grew up as an arm of finance and accounting and was later split off into a separate unit. Because of this, the relationship between IT and finance and accounting is often either too cozy (if the split was friendly) or too adversarial (if it wasn’t).
And why do we need the boss on board in the first place? Especially in larger companies, politics can play a huge role in the governance process. It’s only natural that stakeholders in the governance process will fight tooth and nail for the definitions, policies, and procedures that are most favorable to their business units. The boss needs to firmly and consistently champion the process as a whole, and to set guidance that places the overall business strategy for data governance above departmental politics.
Now we’re going to introduce a theme that will return over and over again in different contexts throughout this blog: if you’re the boss, you need to be on board for any of this to work well. By “the boss” I mean the owner if it’s a small business, and a non-IT C-level executive (Chief Executive Officer, Chief Operating Officer, Chief Financial Officer in that order of preference) if it’s a larger business.
Why this order of preference? The CEO by definition has the most clout: typically the COO and Chief Information Officer (CIO) both report to her, and she can easily delegate responsibility for the data governance process jointly through them. The COO, having direct responsibility for day-to-day operations, is the next best choice. The CFO is more of a dicey choice because in most mature businesses IT grew up as an arm of finance and accounting and was later split off into a separate unit. Because of this, the relationship between IT and finance and accounting is often either too cozy (if the split was friendly) or too adversarial (if it wasn’t).
And why do we need the boss on board in the first place? Especially in larger companies, politics can play a huge role in the governance process. It’s only natural that stakeholders in the governance process will fight tooth and nail for the definitions, policies, and procedures that are most favorable to their business units. The boss needs to firmly and consistently champion the process as a whole, and to set guidance that places the overall business strategy for data governance above departmental politics.
Thursday, December 9, 2010
Data Governance (Part One)
This is the first of two articles introducing the concept of data governance.
Consultants and experts in the BI field use the terms “data governance” and “data integration” to talk about how to approach the kinds of problems we’ve been discussing in this section of the material. These fundamental concepts lie at the heart of the “integrated and coordinated” part of the definition we gave earlier for BI as a whole.
When we defined BI we said that both the data and the definitions of what the data mean need to be shared. “Data Governance” is the term that BI professionals use for the process of making sure that happens. This includes things like setting policies and procedures for how data are to be captured, processed, and stored, defining what terms like “revenue” mean for the purpose of making business decisions, defining what is acceptable for knowledge workers to do with data that are being used for decision purposes, and more. In short, what is being governed is the BI life cycle itself.
How data governance works depends mainly on the number of people with a stake in the process. In a small business, the owner may be the only person with a stake. So that owner will call the shots. In a larger business there may be many people of relatively equal clout with a stake in the governance process, and a significant amount of time and effort may need to be expended to make sure each voice is heard. In many larger companies today you may actually find a data governance board, made up of representatives of the IT and non-IT business units, whose mission it is to set corporate standards, policies and procedures for data governance.
Next time: The importance of top management buy-in for successful data governance.
Consultants and experts in the BI field use the terms “data governance” and “data integration” to talk about how to approach the kinds of problems we’ve been discussing in this section of the material. These fundamental concepts lie at the heart of the “integrated and coordinated” part of the definition we gave earlier for BI as a whole.
When we defined BI we said that both the data and the definitions of what the data mean need to be shared. “Data Governance” is the term that BI professionals use for the process of making sure that happens. This includes things like setting policies and procedures for how data are to be captured, processed, and stored, defining what terms like “revenue” mean for the purpose of making business decisions, defining what is acceptable for knowledge workers to do with data that are being used for decision purposes, and more. In short, what is being governed is the BI life cycle itself.
How data governance works depends mainly on the number of people with a stake in the process. In a small business, the owner may be the only person with a stake. So that owner will call the shots. In a larger business there may be many people of relatively equal clout with a stake in the governance process, and a significant amount of time and effort may need to be expended to make sure each voice is heard. In many larger companies today you may actually find a data governance board, made up of representatives of the IT and non-IT business units, whose mission it is to set corporate standards, policies and procedures for data governance.
Next time: The importance of top management buy-in for successful data governance.
Tuesday, December 7, 2010
Drill Down On: Capturing and Processing Data
Previously, we touched on the Capture and Process stages of the BI data life-cycle. This article begins a more in-depth look at these two stages.
When we introduced the concept of BI we put it in the context of a life cycle. The first two steps of the life cycle we defined as capturing and processing data. These two pieces are tied together because the better job we can do in the first step of capturing data, the less work we have to do in the second step of processing it for consumption (which is the third step in our life cycle). All of that sounds wonderful, but it’s never as easy as it sounds, and the bigger a business becomes the more difficult it gets to capture and process the data smoothly.
To illustrate what we’re talking about, think about a specialty retail store. When the store first opens for business, let’s say it starts out with a cash register or point of sale (POS) terminal. If the specialty items that the store sells are rare or interesting enough, in time word will spread beyond the local community in which the store operates. The store owner may create a presence on a social networking site such as Facebook and begin seeing demand from other parts of the country or even the world. This may lead to the creation of an e-commerce web site.
Soon there are sales coming from two sources (one online, the other in-store). While most of the online customers are not local customers, some of them may be. As the business grows bigger and bigger it becomes harder to tell which is which. You may end up with an account for the same customer on each of your sales systems.
This may happen even with just one system, if you’re not very careful about how you set it up and train the people who run the system. For example, an existing customer named Jones wants to buy something. The clerk does a search for “JONES.” Nothing comes up, so the clerk sets up a new account. Nothing came up in the search because the POS system is case-sensitive. So now you have Mr. Jones twice. Good luck later when you try to figure out if he’s a good customer or not.
Next time: A sad but true tale from the "real" world.
When we introduced the concept of BI we put it in the context of a life cycle. The first two steps of the life cycle we defined as capturing and processing data. These two pieces are tied together because the better job we can do in the first step of capturing data, the less work we have to do in the second step of processing it for consumption (which is the third step in our life cycle). All of that sounds wonderful, but it’s never as easy as it sounds, and the bigger a business becomes the more difficult it gets to capture and process the data smoothly.
To illustrate what we’re talking about, think about a specialty retail store. When the store first opens for business, let’s say it starts out with a cash register or point of sale (POS) terminal. If the specialty items that the store sells are rare or interesting enough, in time word will spread beyond the local community in which the store operates. The store owner may create a presence on a social networking site such as Facebook and begin seeing demand from other parts of the country or even the world. This may lead to the creation of an e-commerce web site.
Soon there are sales coming from two sources (one online, the other in-store). While most of the online customers are not local customers, some of them may be. As the business grows bigger and bigger it becomes harder to tell which is which. You may end up with an account for the same customer on each of your sales systems.
This may happen even with just one system, if you’re not very careful about how you set it up and train the people who run the system. For example, an existing customer named Jones wants to buy something. The clerk does a search for “JONES.” Nothing comes up, so the clerk sets up a new account. Nothing came up in the search because the POS system is case-sensitive. So now you have Mr. Jones twice. Good luck later when you try to figure out if he’s a good customer or not.
Next time: A sad but true tale from the "real" world.
Thursday, December 2, 2010
BI Data Life-Cycle: Process
Previously, we introduced a model of the business intelligence (BI) life-cycle with four main stages: Capture, Process, Consume, and Archive. This article deals with the Process stage of the life-cycle.
Just as a factory processes raw material into items that consumers can use, the next step in our data life cycle processes the raw data we have captured into business intelligence data that business owners, managers and other knowledge workers can use. Depending on the size and complexity of the business, this may be as simple as getting the data from a print spool, reformatting it a little and loading it into something like a Microsoft Access database (think back to “Real-World Story #1”). Or it may require a much more industrial-strength solution, especially if the data are captured in many different places.
Why process the data in the first place? Remember the “integrated and coordinated” part of our definition of business intelligence. We want our data to be consistent and a major objective of the processing step is to make sure that we can compare apples to apples across every part of the business. And if you get that step right, it makes actually working with the data a lot easier down the line.
The next article introduces the heart of business intelligence, consuming the data.
Just as a factory processes raw material into items that consumers can use, the next step in our data life cycle processes the raw data we have captured into business intelligence data that business owners, managers and other knowledge workers can use. Depending on the size and complexity of the business, this may be as simple as getting the data from a print spool, reformatting it a little and loading it into something like a Microsoft Access database (think back to “Real-World Story #1”). Or it may require a much more industrial-strength solution, especially if the data are captured in many different places.
Why process the data in the first place? Remember the “integrated and coordinated” part of our definition of business intelligence. We want our data to be consistent and a major objective of the processing step is to make sure that we can compare apples to apples across every part of the business. And if you get that step right, it makes actually working with the data a lot easier down the line.
The next article introduces the heart of business intelligence, consuming the data.
Subscribe to:
Posts (Atom)