We've discussed the ways in which humans interact with data and most recently how the activities of the PRIME model map to job functions. Last but not least we turn our attemtion to the kinds of applications that make sense for each activity.
Produce
Once data are discovered as a result of investigation, creating the data is essentially a data entry function. So from my viewpoint any application that allows data entry into an appropriate record system would work fine for this activity.
Review
My viewpoint on this should be pretty clear by now if you've followed this thread. Review activity is best suited to a reporting application.
Investigate
There are a wide variety of applications available for analysis or investigation, ranging from spreadsheets to web-based visualization tools and data mining. The application space for this function is crowded with vendors including Microsoft, IBM, Cognos, SAP Business Objects, Oracle, Microstrategy, SAS, and numerous others.
Monitor
The monitor function lends itself to applications like dashboard builders and other applications like scorecards and similar performance management tools.
Extrapolate
The applications for this activity will generally be more specialized and may be industry-specific, and may include tools for campaign management, predictive analytics, actuarial analysis, econometrics, and others.
Showing posts with label consumption. Show all posts
Showing posts with label consumption. Show all posts
Friday, January 7, 2011

Thursday, January 6, 2011
Consuming Data: The PRIME Model and Business Functions
Now that we've thought about how humans interact with data, let's discuss it in the context of business functions. Certain types of data consumption activities make more sense for some professionals than for others.
Produce/Investigate
I believe that investigation is best suited to trained knowledge workers where they are available, especially if the business is large. Obviously, if the business is a startup there may be little or no need for investigation, since the owner is knee-deep in the business on a daily basis. The tricky spot is where the business is small, but not so small that the owner can have detailed knowledge of all business activities on a daily basis. Then, the owner or top manager may have no other choice than to roll up her sleeves if she really wants insight into the data.
Since production of data outside the Capture or Process stages of the BI data life-cycle is so closely tied to investigation (as discussed in an earlier article), it only makes sense for these two activities to be performed together.
Review
Passive consumption of static data is best suited for the corporate board of directors (where applicable), executive management, or the public.
Monitor
Monitoring is best suited for line managers and executives (as long as the presentation is not too detailed).
Extrapolate
Extrapolation is definitely a specialized knowledge worker activity, because it usually requires knowledge of concepts such as statistical modeling.
Next Topic: PRIME And Applications
Produce/Investigate
I believe that investigation is best suited to trained knowledge workers where they are available, especially if the business is large. Obviously, if the business is a startup there may be little or no need for investigation, since the owner is knee-deep in the business on a daily basis. The tricky spot is where the business is small, but not so small that the owner can have detailed knowledge of all business activities on a daily basis. Then, the owner or top manager may have no other choice than to roll up her sleeves if she really wants insight into the data.
Since production of data outside the Capture or Process stages of the BI data life-cycle is so closely tied to investigation (as discussed in an earlier article), it only makes sense for these two activities to be performed together.
Review
Passive consumption of static data is best suited for the corporate board of directors (where applicable), executive management, or the public.
Monitor
Monitoring is best suited for line managers and executives (as long as the presentation is not too detailed).
Extrapolate
Extrapolation is definitely a specialized knowledge worker activity, because it usually requires knowledge of concepts such as statistical modeling.
Next Topic: PRIME And Applications
Wednesday, January 5, 2011
PRIME Model: An Integrated View
Having previously discussed the individual data consumption activities, let us now look at how they work together. My idea of an integrated conceptual view is presented in the chart below.

First, note that some data consumption activities have a specific time orientation. Review is focused on past events or data, monitoring on present events or data, and extrapolation on future events or data. Production and investigation of data occur in the present.
Second, there is typically a very specific flow in data consumption patterns, as depicted by the arrows in the chart. Review and monitoring activities typically trigger investigation as to why results (in the case of review) or current conditions (in the case of monitoring activity) are positive or negative. To reflect this I placed an arrow pointing from both of these activities to the investigate activity. Investigation activity often leads to the production of new data, and so I also include an arrow pointing from the investigate activity to the produce activity.
As we pointed out in an earlier article the production of data is also a standalone activity, such as when data are created in earlier stages of the BI data life-cycle. To be precise I probably should also include arrow from the produce activity to the review, monitor, and extrapolate activities. But in the interest of keeping the chart from becoming too cluttered I have omitted them here, and focus on data production as a by-product of data consumption.
Extrapolation is a bit different than reviewing and monitoring in that the assumptions used in extrapolation are typically developed through an investigation process. So there are arrows going both ways between these activities.
Next Topic: PRIME And Business Functions

First, note that some data consumption activities have a specific time orientation. Review is focused on past events or data, monitoring on present events or data, and extrapolation on future events or data. Production and investigation of data occur in the present.
Second, there is typically a very specific flow in data consumption patterns, as depicted by the arrows in the chart. Review and monitoring activities typically trigger investigation as to why results (in the case of review) or current conditions (in the case of monitoring activity) are positive or negative. To reflect this I placed an arrow pointing from both of these activities to the investigate activity. Investigation activity often leads to the production of new data, and so I also include an arrow pointing from the investigate activity to the produce activity.
As we pointed out in an earlier article the production of data is also a standalone activity, such as when data are created in earlier stages of the BI data life-cycle. To be precise I probably should also include arrow from the produce activity to the review, monitor, and extrapolate activities. But in the interest of keeping the chart from becoming too cluttered I have omitted them here, and focus on data production as a by-product of data consumption.
Extrapolation is a bit different than reviewing and monitoring in that the assumptions used in extrapolation are typically developed through an investigation process. So there are arrows going both ways between these activities.
Next Topic: PRIME And Business Functions
Tuesday, January 4, 2011
PRIME Model: Extrapolate Category
In previous articles we discussed aspects of data consumption that involved either the past (review), the present (monitoring), or elements of both (producing and investigating). Unlike reviewing or monitoring, extrapolation attempts to predict future data. This usually takes one of two forms: forecasting (the estimation of key data values in the future based on current values and trends), and predicting outcomes (using statistical probabilities of various events).
The goal of extrapolation activity is to either identify opportunities before they become known to other market participants or to identify and counter future threats before they occur. An example of the former would be an attempt to project which customers are most likely to respond to a marketing campaign in order to most effectively target advertising. An example of the latter would be to attempt to determine which of your best customers is most likely to take his or her business elsewhere; armed with this knowledge one could prevent the impending defection and retain the customer.
Extrapolation entails more risk than other data consumption activities because one must make assumptions about future conditions. Because conditions are subject to change between the time of extrapolation and the future data or conditions to be extrapolated, extrapolations are frequently expressed as scenarios. Different scenarios are created based on differing assumptions about how current trends will play out, and decision makers choose the scenario they believe is most likely to occur and use the chosen scenario to guide the decision process. Other scenarios can be taken into account by the decision makers in creating contingency plans.
Next Topic: PRIME - An Integrated View
The goal of extrapolation activity is to either identify opportunities before they become known to other market participants or to identify and counter future threats before they occur. An example of the former would be an attempt to project which customers are most likely to respond to a marketing campaign in order to most effectively target advertising. An example of the latter would be to attempt to determine which of your best customers is most likely to take his or her business elsewhere; armed with this knowledge one could prevent the impending defection and retain the customer.
Extrapolation entails more risk than other data consumption activities because one must make assumptions about future conditions. Because conditions are subject to change between the time of extrapolation and the future data or conditions to be extrapolated, extrapolations are frequently expressed as scenarios. Different scenarios are created based on differing assumptions about how current trends will play out, and decision makers choose the scenario they believe is most likely to occur and use the chosen scenario to guide the decision process. Other scenarios can be taken into account by the decision makers in creating contingency plans.
Next Topic: PRIME - An Integrated View
Monday, January 3, 2011
PRIME Model: Monitoring Category
Monitoring is conceptually similar to reviewing, but differs in a couple of key respects. First, review activity typically takes place using historical data after a business cycle is complete, while monitoring occurs on a continuous basis with the latest available data. Second, because the subject of a review is typically historical in nature, the audit requirements involved should be expected to be greater than those for data being monitored. (This is not to imply that inaccuracy in any data should be considered acceptable.)
Previously, we noted that the subject of a review process is typically a report. Although you can use reports for monitoring purposes as well, a report may not be the best medium for monitoring. Most managers flip their P/L or income statement to the section of greatest interest to them. The higher up the organizational chart they sit, the farther back in the report they go. Similarly, department heads will focus more keenly on the parts of the report that concern their parts of the business. Given this tendency, it makes good sense to provide those who monitor business processes with only the specific data they need. This leads to the notion of key performance indicators, or KPIs, which we will discuss in greater detail in a future article.
Next Topic: Extrapolate
Previously, we noted that the subject of a review process is typically a report. Although you can use reports for monitoring purposes as well, a report may not be the best medium for monitoring. Most managers flip their P/L or income statement to the section of greatest interest to them. The higher up the organizational chart they sit, the farther back in the report they go. Similarly, department heads will focus more keenly on the parts of the report that concern their parts of the business. Given this tendency, it makes good sense to provide those who monitor business processes with only the specific data they need. This leads to the notion of key performance indicators, or KPIs, which we will discuss in greater detail in a future article.
Next Topic: Extrapolate
Friday, December 31, 2010
PRIME Model: Investigate Category
Of all of the activities in the PRIME model, investigation is probably the one most widely associated in the business person’s mind with the function of the contemporary knowledge worker/analyst. The analyst, typically responding to a query from management resulting from a reviewing or monitoring activity, examines data at increasing levels of detail in order to find out for the boss what went right or wrong. This examination at levels of increasing detail is often referred to as “drilling down” or “drilling in” to the data. If successful, the investigator uncovers information that was previously unknown and produces new data.
As business processes have become more complex and the amount of data collected about them has grown exponentially, some aspects of the investigation function have been automated through the introduction of data mining tools. In these cases the role of the analyst changes from that of interacting directly with data by drilling down into the details to a more interpretive role of determining the meaning of results from data mining output. However, the analyst’s fundamental investigative function is unchanged. The analyst may well drill down into data in order to better understand and quantify hidden relationships unearthed by the data mining process.
Next Topic: Monitor
As business processes have become more complex and the amount of data collected about them has grown exponentially, some aspects of the investigation function have been automated through the introduction of data mining tools. In these cases the role of the analyst changes from that of interacting directly with data by drilling down into the details to a more interpretive role of determining the meaning of results from data mining output. However, the analyst’s fundamental investigative function is unchanged. The analyst may well drill down into data in order to better understand and quantify hidden relationships unearthed by the data mining process.
Next Topic: Monitor
Thursday, December 30, 2010
PRIME Model: Review Category
Among the activity categories that are most strongly associated with data consumption, reviewing is the most passive. By definition, “reviewing” implies looking back on events that have already occurred in the past. Most traditional forms of reporting are examples of the Review category. Profit and Loss, Changes in Cash Flow, Balance Sheets – all entail looking passively at static data.
In most traditional business firms, review is the first step in a cyclical management process. It goes something like this. Management from the top down reviews quarterly or annual results. This review process typically triggers inquiries about how or why results occurred (or didn’t). The inquiries are then passed to knowledge workers who interact with data in more dynamic ways (as we’ll discuss later) in order to provide answers to the queries.
I was tempted to call this category the “report” category. It’s true that all the examples I cited a couple of paragraphs ago are traditional reports. But I resisted the impulse because I wanted the model to be activity based, and a report is more appropriately considered as the object of the “review” activity than as an activity in itself. And it’s also possible that the object of a review could be something other than a report, although nothing else comes immediately to mind.
Next Topic: Investigate
In most traditional business firms, review is the first step in a cyclical management process. It goes something like this. Management from the top down reviews quarterly or annual results. This review process typically triggers inquiries about how or why results occurred (or didn’t). The inquiries are then passed to knowledge workers who interact with data in more dynamic ways (as we’ll discuss later) in order to provide answers to the queries.
I was tempted to call this category the “report” category. It’s true that all the examples I cited a couple of paragraphs ago are traditional reports. But I resisted the impulse because I wanted the model to be activity based, and a report is more appropriately considered as the object of the “review” activity than as an activity in itself. And it’s also possible that the object of a review could be something other than a report, although nothing else comes immediately to mind.
Next Topic: Investigate
Tuesday, December 28, 2010
How We Interact With Data: The PRIME Model
Based on my experience and observations, I classify the way in which humans interact with data into five categories of activity:
Produce
This activity consists mainly of creating, updating, and transforming data and is the primary focus of the Capture and Process phases of the BI life-cycle.
Review
The focus of this activity is the passive consumption of static data.
Investigate
This activity involves a person drilling into or analyzing data in an effort to answer questions about one or more business processes represented by the data. Some of this activity may be automated through the use of data mining tools.
Monitor
I define monitoring as the exact opposite of reviewing; that is, active consumption of dynamic data. More on this later.
Extrapolate
Unlike other activities that focus on past results or present conditions, extrapolation attempts to predict future outcomes based on present conditions. The goal of this activity is to capitalize on potential future opportunities while avoiding or minimizing potential future threats.
Those of you who have poked into business intelligence before have probably run across a conceptual model that is different from this, in that it represents BI as a pyramid, like the following graph:
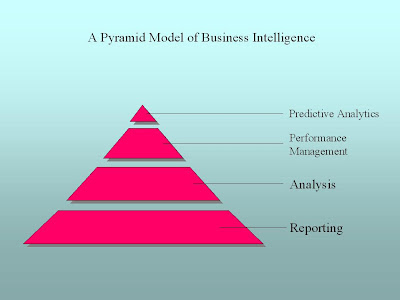
I like the PRIME approach over the pyramid approach for the following reasons:
1. There’s an implication that the higher you are on the pyramid the more sophisticated you are as a business intelligence operation. PRIME doesn’t care about that, but rather sticks to the activities involved so you can focus on the right tool for the activity.
2. Various manifestations of the pyramid approach tend to focus on applications like reporting, analysis, etc. As we’ll see, PRIME maps into these applications pretty well, but PRIME focuses on the activity rather than the application used for the activity.
Next, we’ll dig deeper into the activity categories of the PRIME model.
Next Topic: Produce
Produce
This activity consists mainly of creating, updating, and transforming data and is the primary focus of the Capture and Process phases of the BI life-cycle.
Review
The focus of this activity is the passive consumption of static data.
Investigate
This activity involves a person drilling into or analyzing data in an effort to answer questions about one or more business processes represented by the data. Some of this activity may be automated through the use of data mining tools.
Monitor
I define monitoring as the exact opposite of reviewing; that is, active consumption of dynamic data. More on this later.
Extrapolate
Unlike other activities that focus on past results or present conditions, extrapolation attempts to predict future outcomes based on present conditions. The goal of this activity is to capitalize on potential future opportunities while avoiding or minimizing potential future threats.
Those of you who have poked into business intelligence before have probably run across a conceptual model that is different from this, in that it represents BI as a pyramid, like the following graph:

I like the PRIME approach over the pyramid approach for the following reasons:
1. There’s an implication that the higher you are on the pyramid the more sophisticated you are as a business intelligence operation. PRIME doesn’t care about that, but rather sticks to the activities involved so you can focus on the right tool for the activity.
2. Various manifestations of the pyramid approach tend to focus on applications like reporting, analysis, etc. As we’ll see, PRIME maps into these applications pretty well, but PRIME focuses on the activity rather than the application used for the activity.
Next, we’ll dig deeper into the activity categories of the PRIME model.
Next Topic: Produce
Monday, December 27, 2010
Consuming Data: Introduction
Previously, we’ve discussed the first two stages in the business intelligence life-cycle, capture and processing. Once you’ve completed those steps and have data in your data warehouse or Microsoft Access database, what then? The answer to that question depends on the (1) questions you want to ask and (2) how you want to interact with the data.
The Questions I Want To Ask?
Well, duh, you say. But believe it or not, it seems to me that sometimes business people think the software is going to tell them everything they need to know without needing to ask. I remember as a kid watching the old “Batman” TV series. (Yes, it was first-run, not reruns; I am that old.) Whenever the Caped Crusader got stumped, he would feed the available data into the trusty “Bat Computer” and it would spit out the exact answer he needed. It seemed effortless, especially to a seven-year-old. (OK, I’m not that old!) Even the tools we have today for data mining and analytics aren’t as precise as the Bat Computer. So, although it may seem ridiculous you really do need to think about what kinds of questions you want to answer.
The more specific you can make your questions, the better off you’ll be. For example, “how are we doing this quarter?” isn’t really that great a question. A better question would be, “what are the trends of our sales and profit, for the quarter to date, quarter over quarter, and year over year?” If you’re already thinking in those terms, great! We’re ready to start thinking about how we interact with the data.
The Questions I Want To Ask?
Well, duh, you say. But believe it or not, it seems to me that sometimes business people think the software is going to tell them everything they need to know without needing to ask. I remember as a kid watching the old “Batman” TV series. (Yes, it was first-run, not reruns; I am that old.) Whenever the Caped Crusader got stumped, he would feed the available data into the trusty “Bat Computer” and it would spit out the exact answer he needed. It seemed effortless, especially to a seven-year-old. (OK, I’m not that old!) Even the tools we have today for data mining and analytics aren’t as precise as the Bat Computer. So, although it may seem ridiculous you really do need to think about what kinds of questions you want to answer.
The more specific you can make your questions, the better off you’ll be. For example, “how are we doing this quarter?” isn’t really that great a question. A better question would be, “what are the trends of our sales and profit, for the quarter to date, quarter over quarter, and year over year?” If you’re already thinking in those terms, great! We’re ready to start thinking about how we interact with the data.
Friday, December 3, 2010
BI Data Life-Cycle: Consume
This is the latest in a series of articles discussing the life-cycle of business intelligence (BI) data. We've been discussing a model with four main stages: Capture, Process, Consume, and Archive. This article introduces consumption of the data.
Once we have the processed our raw data, we’re ready to interact with it in order to try to understand what’s going on with our business. This step of the process, the actual interaction with and consumption of our data, is what most people think of as business intelligence, if they think of it at all. How you consume the data depends on a number of different things: the size of your business, your stake in that business, and the kinds of questions you want to answer.
If your business is small or you run a small business unit in a bigger company, you’re probably intimately involved with your data at a pretty detailed level. For one thing, you’re probably out there in the trenches with your customers every day. You need to know things like your costs and margins so that you can make quick adjustments in negotiations. For another thing, you probably can’t afford a dedicated analyst at this stage. On the other hand, if you’re in a bigger business, there’s probably more of a division of labor between the higher-level managers and the knowledge workers (whom the managers can probably now afford). The boss doesn’t want to be intimately involved in the gory details, and if you’re the knowledge worker you probably don’t want him or her to be intimately involved either.
The kind of stake you hold in the business also has a lot to do with how you consume the data. The general rule here is: the higher you are in the organization, or the farther away you are from it, the less detail you need. All shareholders usually want or need is what they get in the quarterly and annual reports released by a corporation. These are mainly static reports about things like profit and loss and changes in cash flow. The corporation’s board of directors really doesn’t need much more than that; mainly the board needs sufficient data at a high level to help the directors determine whether the business strategy they approved is working or not. The CEO needs a little more detail, and the different business unit managers need still more detail about their units, and so it goes.
As you become more comfortable with your data you may find that you want to ask more and different kinds of questions. Everyone starts out with “how much did we make last month?” but that’s just the tip of the iceberg, so to speak. To really understand your business you’ll eventually start to ask more complicated things like:
• Who are our best customers?
• Where do our sales really come from?
• What are our most profitable product offerings?
• Which products should we discontinue?
• How do we get the most out of our advertising dollars?
• . . . and a host of others
What we’ll see is that we consume data differently depending on the kinds of questions we want to ask. Later, we’ll discuss at some length five main ways that we consume data and talk about the tools that are available for each type or class of data consumption.
Next we'll wrap up our discussion of the life-cycle with a word about archiving.
Once we have the processed our raw data, we’re ready to interact with it in order to try to understand what’s going on with our business. This step of the process, the actual interaction with and consumption of our data, is what most people think of as business intelligence, if they think of it at all. How you consume the data depends on a number of different things: the size of your business, your stake in that business, and the kinds of questions you want to answer.
If your business is small or you run a small business unit in a bigger company, you’re probably intimately involved with your data at a pretty detailed level. For one thing, you’re probably out there in the trenches with your customers every day. You need to know things like your costs and margins so that you can make quick adjustments in negotiations. For another thing, you probably can’t afford a dedicated analyst at this stage. On the other hand, if you’re in a bigger business, there’s probably more of a division of labor between the higher-level managers and the knowledge workers (whom the managers can probably now afford). The boss doesn’t want to be intimately involved in the gory details, and if you’re the knowledge worker you probably don’t want him or her to be intimately involved either.
The kind of stake you hold in the business also has a lot to do with how you consume the data. The general rule here is: the higher you are in the organization, or the farther away you are from it, the less detail you need. All shareholders usually want or need is what they get in the quarterly and annual reports released by a corporation. These are mainly static reports about things like profit and loss and changes in cash flow. The corporation’s board of directors really doesn’t need much more than that; mainly the board needs sufficient data at a high level to help the directors determine whether the business strategy they approved is working or not. The CEO needs a little more detail, and the different business unit managers need still more detail about their units, and so it goes.
As you become more comfortable with your data you may find that you want to ask more and different kinds of questions. Everyone starts out with “how much did we make last month?” but that’s just the tip of the iceberg, so to speak. To really understand your business you’ll eventually start to ask more complicated things like:
• Who are our best customers?
• Where do our sales really come from?
• What are our most profitable product offerings?
• Which products should we discontinue?
• How do we get the most out of our advertising dollars?
• . . . and a host of others
What we’ll see is that we consume data differently depending on the kinds of questions we want to ask. Later, we’ll discuss at some length five main ways that we consume data and talk about the tools that are available for each type or class of data consumption.
Next we'll wrap up our discussion of the life-cycle with a word about archiving.
Subscribe to:
Posts (Atom)